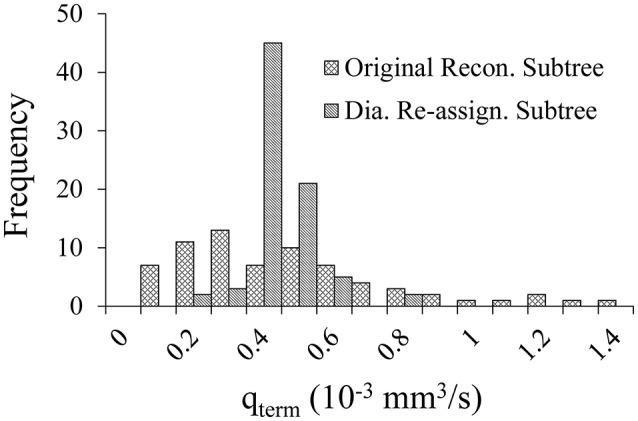
Figure 2.

Comparison of the flow distribution in the terminal pre-capillary arterioles in the 400-vessel subtree under shear and myogenic controls prior vs. after diameter re-assignment. Each bin on the X-axis represents a 0.05 × 10⁻³ mm3/s range of terminal pre-capillary flows per cardiac cycle. The Y-axis is the pre-capillary frequency for each bin.
