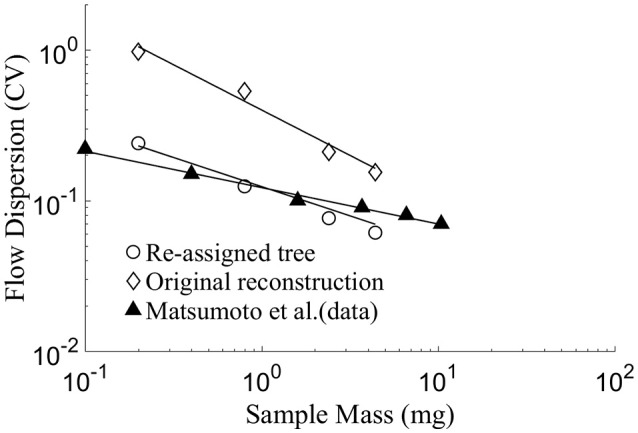
Figure 4.

Log-log plot of model prediction and data of flow dispersion (represented by CV = SD/Mean) vs. perfused sample mass. The slope of the linear fit equals 1–D, where D being the fractal dimension (Bassingthwaighte et al., 1989). The results yield D = 1.44 for the diameter-reassigned tree, D = 1.62 for the original reconstructed tree, D = 1.24 for the data of Matsumoto et al. (1999) in the sub-endocardial region. There is a close agreement between the data of Matsumoto et al. and the present model prediction for the diameter re-assigned tree, while predictions of the original reconstructed tree yields a CV of up to an order of magnitude higher than the data.
