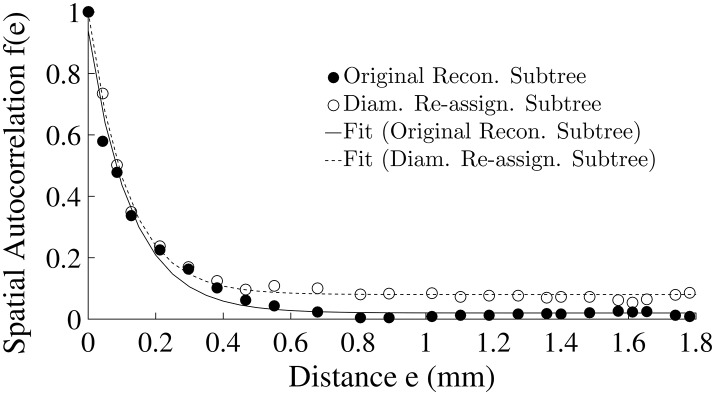
Figure 5.
Flow spatial autocorrelation function between pairs of pre-capillary arterioles as a function of their spatial distance (Equation 4). Symbols are model estimates. The curves are single term exponentials of the form a · exp (−e/e0) + c fit to f(e) of the two subtrees. The parameter estimates are listed in Table 3.

