Figure 2.
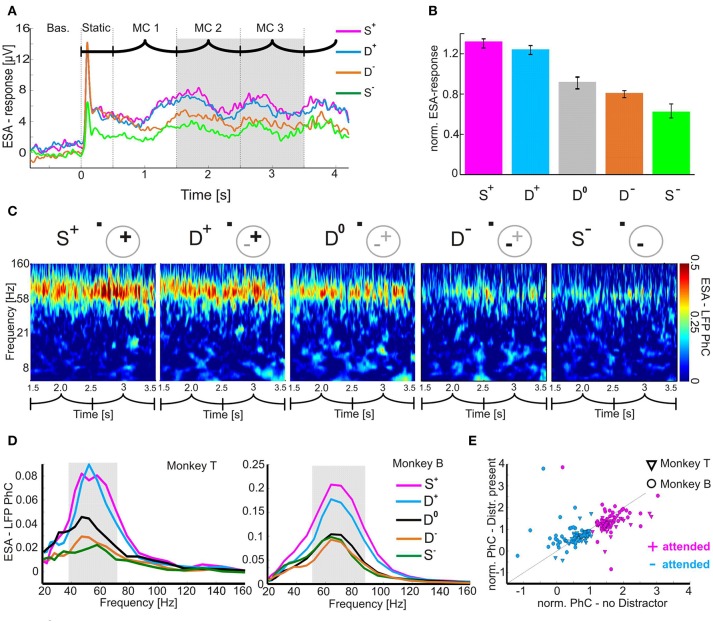
Attention-dependent modulation of neuronal responses and their coupling to the local population activity. (A) Time course of mean ESA-responses during the shape-tracking task of an example case (visual stimulation sequence indicated above as in Figure 1). For clarity, the D0-condition is omitted. (B) Histogram of normalized median ESA-responses during MC 2 and 3 (highlighted gray in A) and pooled over both animals. Error-bars indicate 95 % confidence intervals. (C) Time-frequency plots of the PhC between ESA and LFP for all task conditions during MC 2 and 3 of an example case. Pictograms indicate stimulus configuration within the V4 pRF. Plus and minus signs depict the stimuli inducing stronger and weaker γ-PhC, respectively. Bold highlighted signs correspond to the attended stimulus. (D) Median spectra for ESA-LFP PhC of both animals. The individual γ-bands are highlighted in gray. (E) Scatter-plot of normalized ESA-LFP PhC (median over MC 2/3 and the individual γ-band) for conditions without vs. with distractor in pRF.

