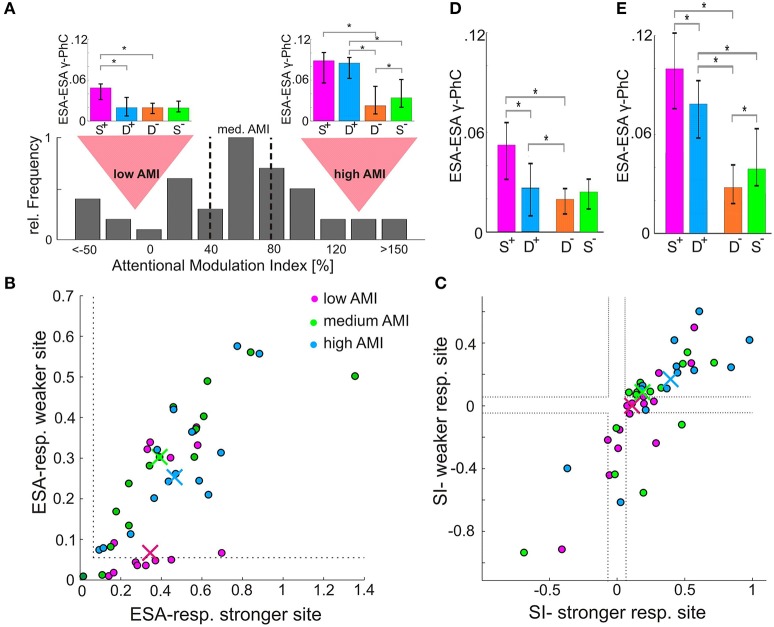
Figure 3.
Dependence of ESA-ESA γ-PhC modulation on level of ESA-responses and stimulus specificity. (A) Distribution of AMI-values based on ESA-ESA γ-PhC (n = 44). The dashed vertical lines indicate borders between the third with lowest, the third with medium, and the third with highest AMI-values. The bar-plot insets above the distribution depict for the low and the high AMI group the median normalized γ-PhC between ESA-signals, which determine the AMI values. (B) Scatter-plot of normalized ESA-responses for the stimulus inducing higher γ-PhC between ESA-signals (S+ condition). An entry represents the ESA-responses of both recording sites contributing to the γ-PhC, with the site showing higher ESA-responses plotted on the X-axis. The different colors represent the high, medium, and low AMI-group, as illustrated in (A). The median values for each group are depicted as correspondingly colored crosses. (C) Same as in (B), but for the stimulus specificity of the sites constituting a pair. Sites showing higher SI-values are plotted on the X-axis. (D) Histogram of median normalized γ-PhC between ESA signals of the unspecific group (at least one site with ESA-responses below 0.05, see B or SI-values between −0.05 and 0.05 or with opposite stimulus preference, see (C) cases between dashed lines and in lower right quadrant). The error-bars indicate 95% confidence intervals. Asterisks indicate significant differences (p < 0.05) (E) same as in D, but for the specific group (pairs which were not classified as unspecific, see D).

