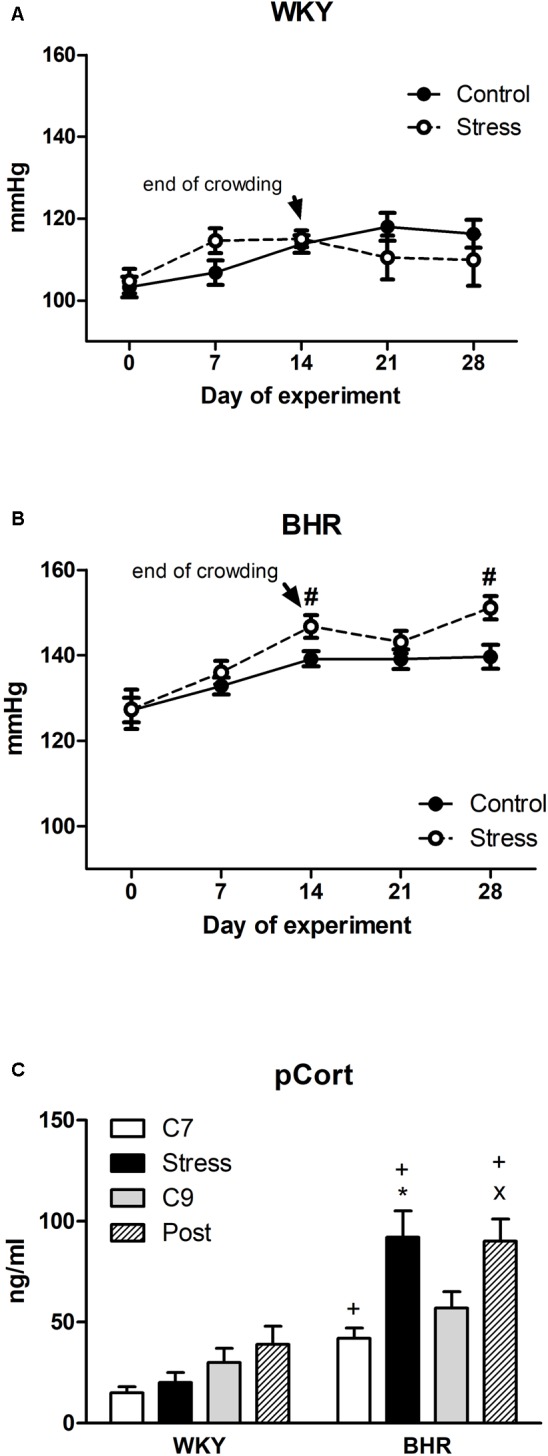
FIGURE 1.

Blood pressure (A,B) and plasma corticosterone (pCort, C) of normotensive Wistar-Kyoto (WKY) and borderline hypertensive (BHR) rats. Controls (C7 and C9) were kept in control conditions throughout the course of experiment. Stressed rats were exposed to crowding for 2 weeks (days 1–14). After cessation of stress, one group of rats (post-stressed rats, Post) was returned to control conditions for the next 2 weeks. The results are mean ± SEM, n = 8–10/group for blood pressure, n = 6–8/group for pCort. Symbols: #p < 0.05 vs. controls of the same phenotype, ∗p < 0.05 vs. 7-week controls (C7) of the same phenotype, xp < 0.05 vs. 9-week controls (C9) of the same phenotype, +p < 0.05 vs. the same WKY group.
