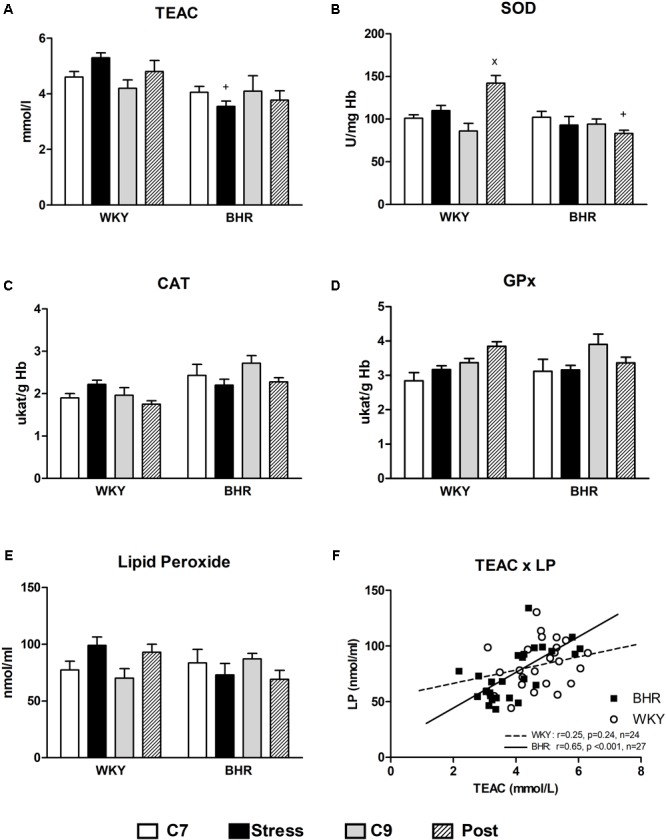
FIGURE 3.

Parameters of oxidative status (A–E) in the blood of normotensive Wistar-Kyoto (WKY) and borderline hypertensive (BHR) rats in 7-week controls (C7, white bar), stress (black bar), 9-week controls (C9, gray bar) and post-stress (Post, strip bar). (F) Shows correlations between TEAC and LP in WKY and BHR rats. CAT, catalase; GPx, glutathione peroxidase; Hb, hemoglobin; LP, lipid peroxides; SOD, Cu/Zn- superoxide dismutase; TEAC, trolox equivalent antioxidant capacity of plasma. The results are mean ± SEM, n = 6–7/group. Symbols: xp < 0.05 vs. nine-week controls (C9) of the same phenotype, +p < 0.05 vs. the same WKY group.
