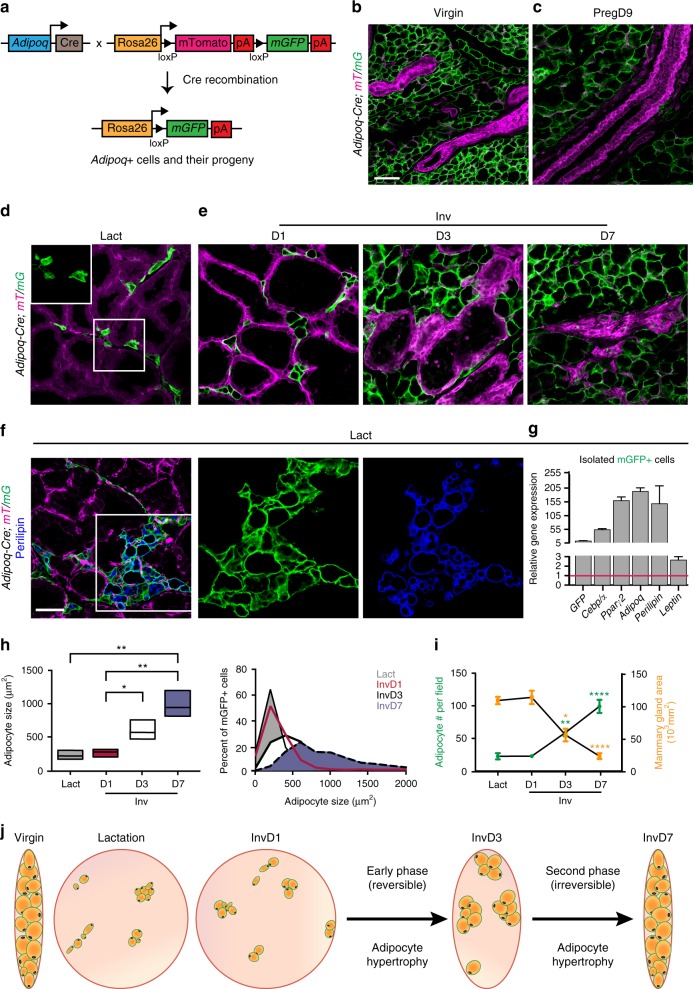
Fig. 1.
Adipocyte and MG dynamics throughout the lactation cycle. a Schematic summarizing genetic strategy to express mGFP in mature adipocytes. b–f Representative images of adipocytes (green) and all other cell types (magenta) in MGs from Adipoq-Cre; mT/mG mice at a mature, virgin stage (b), pregnancy day 9 (c), lactation day 10 (d, f), and involution days 1, 3, and 7 (e). Scale is equivalent in b–e. Tissue in f is also stained with anti-perilipin antibodies. g Representative qPCR results showing expression of mature adipocyte-associated genes in small mGFP+ cells isolated from lactating MGs normalized to total stromal vascular fraction. h Average (left panel) and distribution (right panel) of the size (cross-sectional area) of mGFP+ cells at the indicated time points. n ≈ 900 adipocytes in three mice for each time point. i Average number of adipocytes per field (left axis) and area of a 2D cross section of the MG (right axis) at the indicated time points. n ≈ 15–315 fields or one 2D cross section in each of 3–5 mice. j Schematic summarizing changes during the lactation cycle to the size of the MG, and size and distribution of adipocytes. Error bars represent mean ± SEM. Significance was calculated using a two-tailed unpaired t-test to compare individual time points (h) or one-way ANOVA with Tukey’s multiple comparison test (i). *P < 0.05, **P < 0.01, ****P < 0.0001. Bounds of box plot (h) reflect data min and max with centre line at the mean. White boxes indicate insets and scale bars are 50 μm. Preg pregnancy, Inv involution, Lact lactation, D day, mT/mG membrane tomato/membrane GFP, MG mammary gland, n.s. not significant

