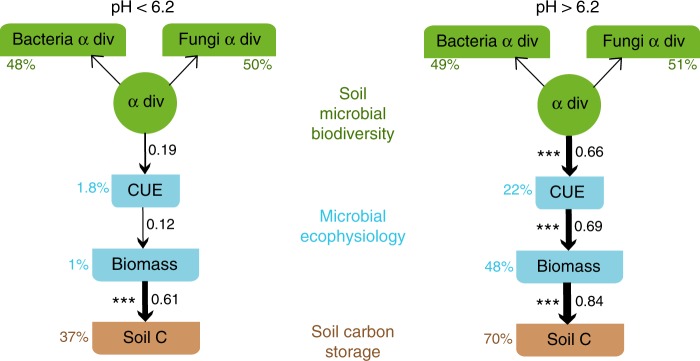
Fig. 3.
Model outcome of expected causal relationships. Most fitting paths of causality obtained through structural equation modeling for the two datasets across the soil pH threshold value of 6.2 (pH < 6.2: n = 50, CFI = 1, RMSEA = 0, SRMR = 0.079, AIC = 693, P = 0.67; pH > 6.2: n = 113, CFI = 1, RMSEA = 0, SRMR = 0.039, AIC = 1396, P = 0.57). Percentage figures next to the variables indicate their explained variance (R2). Figures on the arrows indicate standardized path coefficients and asterisks mark their significance; ***<0.001

