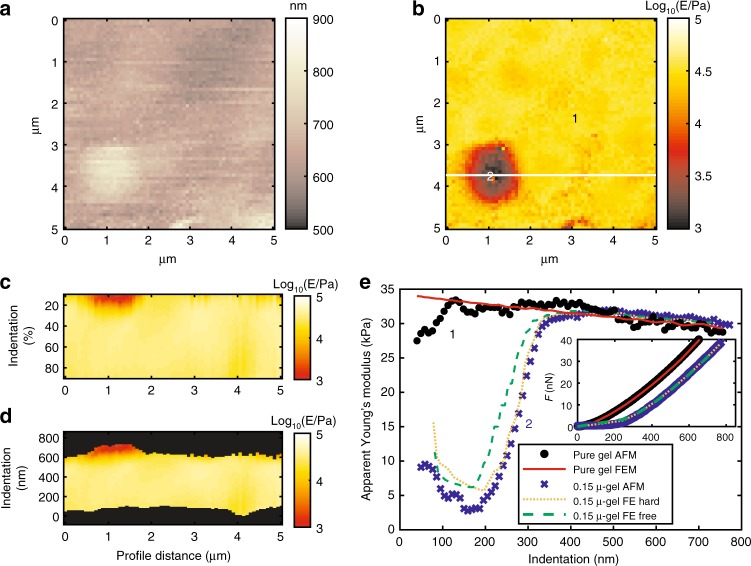
Fig. 2.
Graphical results of mechanical analysis by AFMech Suite for 0.15 μ-gel. a Morphology map at zero force, vertical color bar represents height in nm. b Young’s modulus map in logarithmic scale at medium indentation (0–20% of maximum value). c Qualitative Young’s modulus tomography on relative indentation from white line in (b). d Qualitative Young’s modulus tomography on absolute indentation from line in (b). Vertical color bar for (b–d) represents logarithm base 10 of Young’s modulus in Pa. e Apparent Young’s modulus vs. indentation (inset: force vs. indentation) for points 1 and 2 of (b) comparing AFM results and FEM simulations for boundary conditions: no slip (FE hard) and free to slip (FE free)

