Fig. 5.
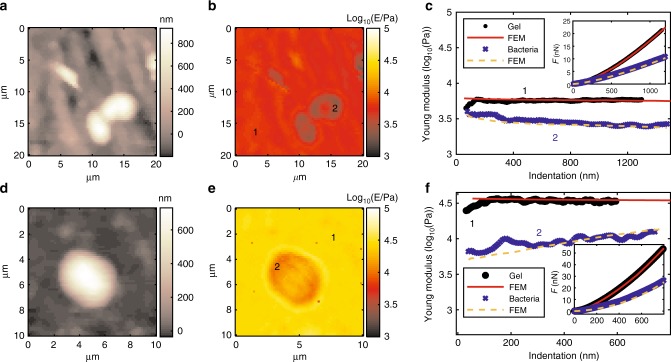
Results of mechanical analysis for E. coli supported on hydrogels. Bacteria supported on hard hydrogel (6 kPa). a Morphology map at zero force, vertical color bar represents height in nm. b Young’s modulus map at medium indentation (20–40%), vertical color bar represents logarithm base 10 of Young’s modulus in Pa. c Young’s modulus vs. indentation (inset: force vs. indentation) for points 1 and 2 of (b) comparing AFM results and FEM simulations. Bacteria supported on hard hydrogel (6 kPa). d Morphology map at zero force. e Young’s modulus map at medium indentation (20–40%). f Young’s modulus vs. indentation (inset: force vs. indentation) for points 1 and 2 of (b) comparing AFM results and FEM simulations

