Fig. 3.
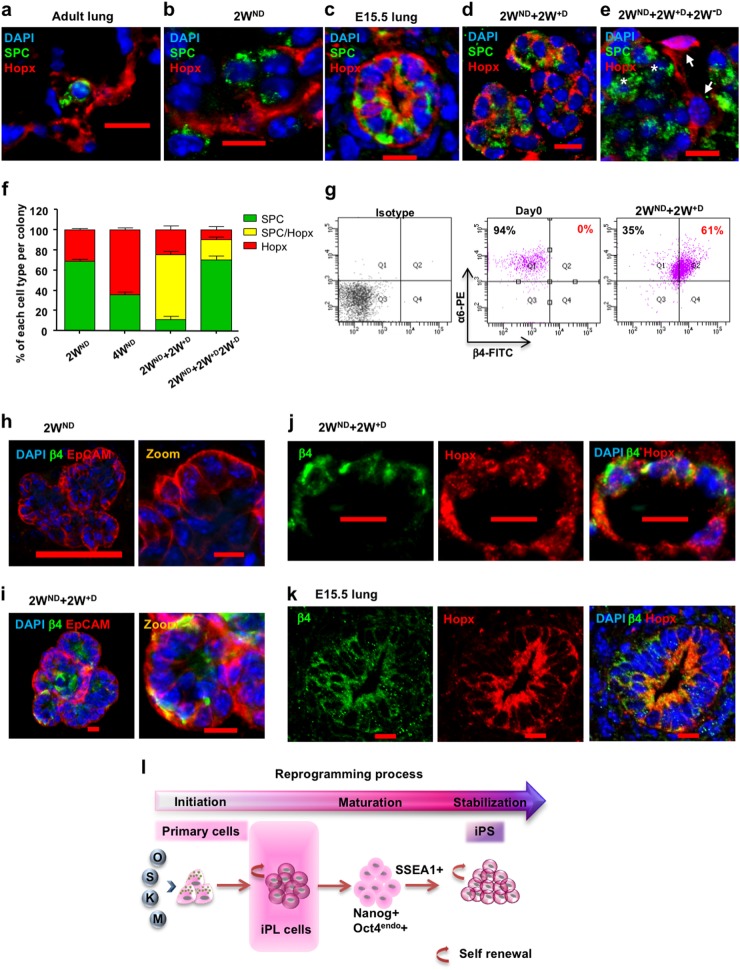
The expression of alveolar progenitor markers in AEC-II-iPL cells. Confocal microscopic images depict the expression of Hopx and SPC in: a adult lung; b colonies derived from AEC-II cells after a 2-week culture period in the absence of Dox (2WND); c E15.5 lungs; d passaged 2WND colonies induced with Dox for 2 weeks (2WND + 2W+D); e colonies were passaged and cultured without Dox for 2 subsequent weeks (2WND + 2W+D + 2W−D), with nuclear stain DAPI (blue), SPC (green), and Hopx (red). f Quantification of each cell type (SPC single positive; Hopx single positive; SPC and Hopx double positive) in colonies obtained from different groups. g Flow cytometric analysis of integrin α6 and β4 expression levels in day 0 freshly isolated AEC-II cells and 2WND + 2W+D cells. Confocal microscopic images of colonies derived from AEC-II cells after 2-week culture without Dox (2WND) h and 2WND + 2W+D colonies (2WND + 2W+D) i, showing nuclear stain DAPI (blue), β4 (green), and EpCAM (red). Confocal microscopic images depicting the co-expression of Hopx and SPC in 2WND + 2W+D cells j and E15.5 lungs k, with nuclear stain DAPI (blue), β4 (green), and Hopx (red). l Cartoon depicting the generation of iPL cells using interrupted reprogramming. For f, values are mean ± S.D. of three independent biological replicates. In g, data are representative of a minimum of three independent biological replicates. Scale bar, 10 µm (a–e, h—zoom, i–k), 100 µm (h—left panel)

