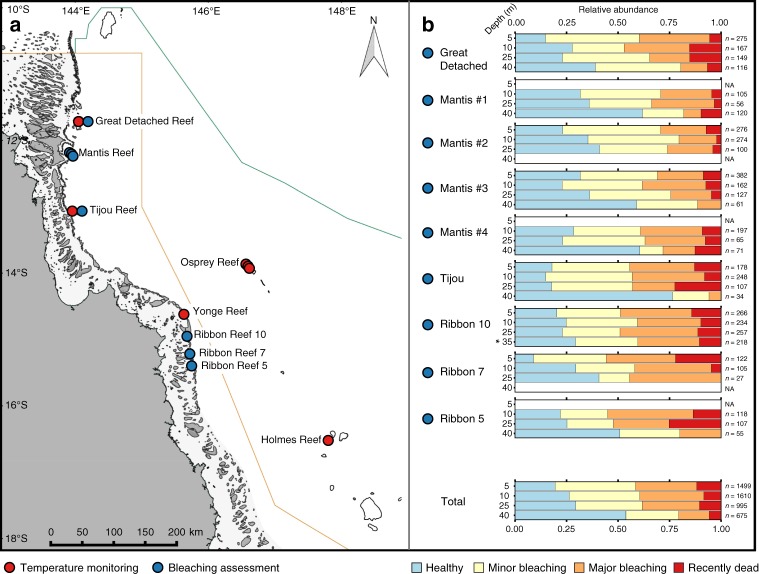
Fig. 1.
Overview of surveyed locations and respective bleaching impacts over depth. a Reef locations for which long-term temperature recordings (red dots) and/or bleaching surveys (blue dots) were obtained on the Great Barrier Reef (GBR) and in the Western Coral Sea (WCS). b Community-wide bleaching severity over depth (5, 10, 25 and 40 m depth) during the 2016 mass bleaching event. Stacked bar graphs give the relative abundance of bleaching categories for each depth and location. Number of observations noted next to each stacked bar, with NA denoting depths that lacked a coral reef community. Asterisk (*) indicates site where data was collected at 35 m depth due to absence of reef formation at 40 m. Bleaching surveys were performed on 14–23 May 2016, ∼10 weeks after the first reports of minor to moderate coral bleaching in three management areas of the GBR Marine Park17. Map created with data files courtesy of Great Barrier Reef Marine Park Authority and www.deepreef.org under CC BY 4.0

