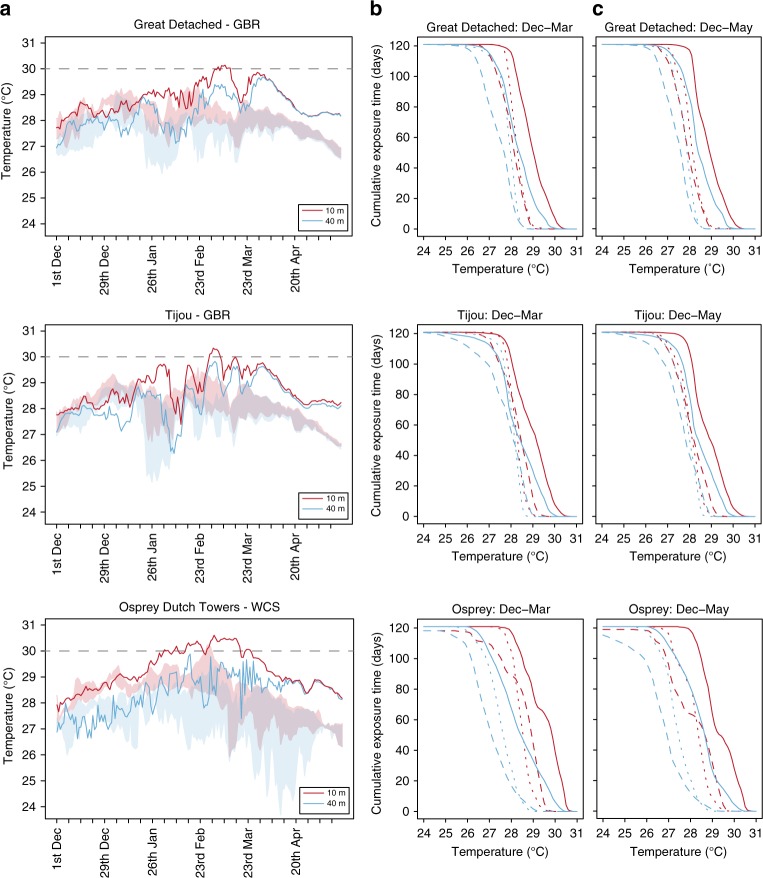
Fig. 3.
Temperature profiles during the 2016 bleaching event compared with the three previous years. a Daily average temperatures at 10 and 40 m during the warmest months in 2016, compared with the daily minimum and maximum temperatures recorded in the three previous years (indicated with shading). b Cumulative exposure times (days) and temperatures (0.1 °C) shown for three consecutive 1 December–31 March periods. c Cumulative exposure times (days) and temperatures (0.1 °C) shown for three consecutive 1 December–17 May periods. Dotted lines refer to 2013–2014, dashed lines to 2014–2015 and solid lines to 2015–2016

