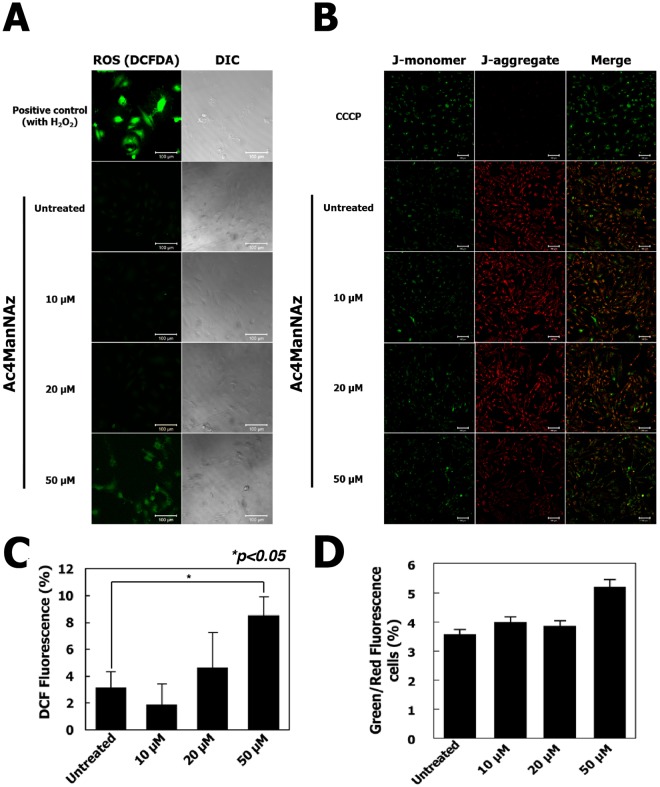
Figure 5.
Analysis of reactive oxygen species (ROS) production and mitochondrial function in hUCB-EPCs treated with Ac4ManNAz. (A) hUCB-EPCs were treated with 0, 10, 20, or 50 μM Ac4ManNAz, and intracellular ROS levels were then measured using the fluorescent probe 2′, 7′-dichlorfluorescein-diacetate (DCFH-DA). (B) Changes in mitochondrial membrane potential (ΔΨm) were measured in hUCB-EPCs using the fluorescent probe JC-1. (C) Quantification of ROS generation are expressed as the percentage of fluorescence intensity relative to the control. (D) Value of mitochondrial membrane potential were expressed as % Green/Red fluorescence cells.

