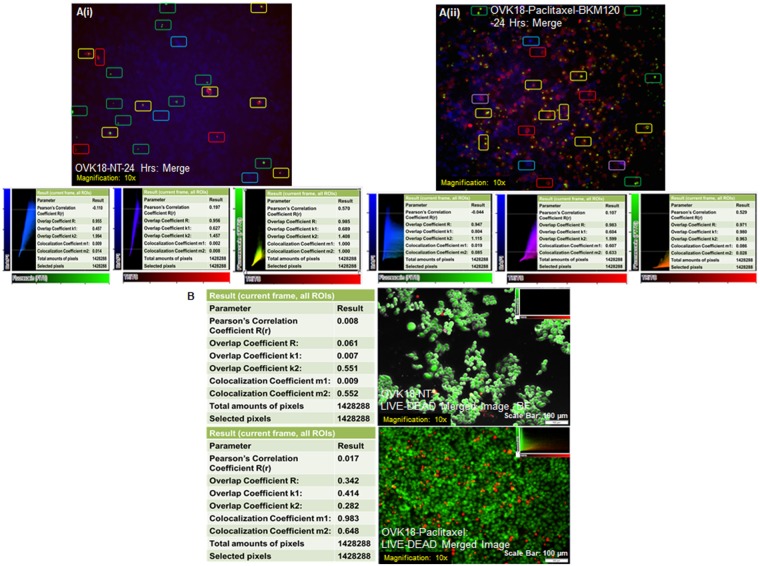
Figure 4.
Pixel co-localization between FITC (NucView488 casp3 Substrate and Calcein AM), DAPI (MitoView Blue) and TRITC (CF 594 Annexin V and EthD-1) channels from live cell images of paclitaxel (2.5 nM) + BKM120 (500 nM) treated OVK18 cells stained for triple fluorescence (A) and paclitaxel (2.5 nM) treated live-dead OVK18 cells (B) was presented. (A) Co-localization between FITC, DAPI, and TRITC channels was determined in the scatterplot (inset) of merged (channels). Image applied to all frames with a target area of whole frames (total 1428288 pixels and selected1428288 pixels). Pixel co-localization between DAPI–FITC (upper inset), DAPI–TRITC (middle inset), and FITC – TRITC (lower inset), channels with co-efficient parameters are presented (insets) in non-treated (NT; Ai) and drug-treated (Paclitaxel-BKM120; Aii) OVK18 cells. A few cells with red and green stain are marked with yellow boxes, and cells with red and blue stain are marked with violet boxes. A few cells with red, blue, and green stains are marked with red, blue, and green boxes respectively. The co-location pattern of three channels are found to be characteristically different between NT and treated group. (B) Co-localization between FITC and TRITC channels was determined in the scatterplot (inset) of merged (channels). Image applied to all frames with a target area of whole frames (total 1428288 pixels and selected1428288 pixels). Upper panel represents non-treated (NT) live-dead OVK18 cells. Pearson’s Correlation Coefficient R(r) [Whole Frame] was 0.017 (A perfect positive linear relationship, r = 1). Overlap Coefficient was 0.342. Overlap Coefficient K1 [Whole Frame] was 0.414 and K2 [Whole Frame] 0.282. Co-localization co-efficient M1(whole frame) was 0.983 M2 (whole frame) was 0.648. The lower panel represents paclitaxel-treated (Paclitaxel) live-dead OVK18 cells. Co-localization between FITC and TRITC channels was determined in the scatterplot (inset) of merged (channels). Image applied to all frames with a target area of whole frames (total 1428288 pixels and selected1428288 pixels). Pearson’s Correlation Coefficient R(r) [Whole Frame] was 0.008. (A perfect positive linear relationship, r = 1). Overlap Coefficient was 0.061. Overlap Coefficient K1 [Whole Frame] was 0.007, and K2 [Whole Frame] was 551. Co-localization co-efficient M1(whole frame) was 0.009 M2 (whole frame) was 0.552.

