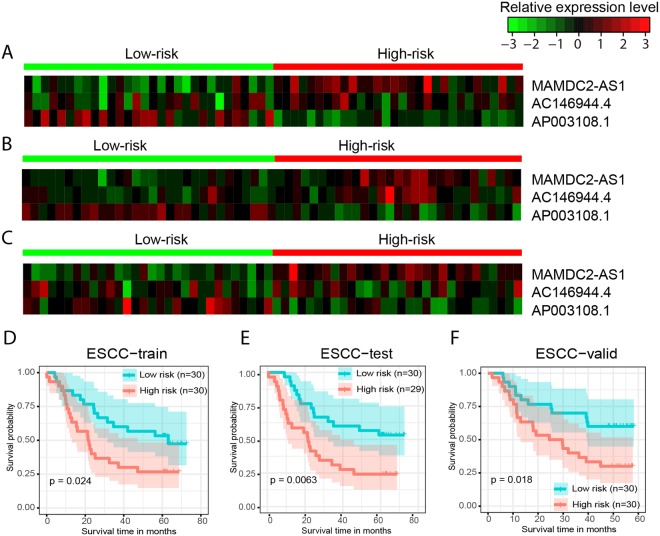
Figure 5.
The three-lncRNA signature predicts overall survival of patients with ESCC. Heat maps of z-score transformed expression values for each lncRNA (A–C), and Kaplan–Meier survival curves of patients classified into high- and low-risk groups using the three-lncRNA signature (D–F). P values were calculated using the log-rank test. (A,D) ESCC-train dataset, 60 patients. (B,E) ESCC-test dataset, 59 patients. (C,F) ESCC-valid dataset, 60 patients.

