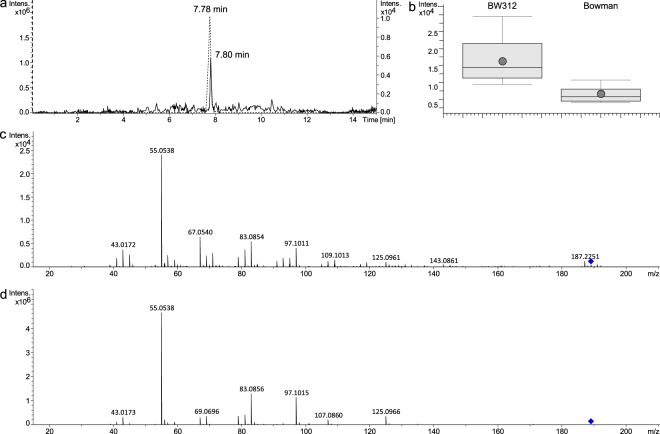
Figure 3.
Identification of azelaic acid. The retention time and mass spectra of azelaic acid were obtained using an authentic standard. (a) EIC (extracted ion chromatogram) of azelaic acid is shown for a barley sample (straight line) and the standard (dashed line). (b) Higher intensities of azelaic acid were found in BW312 extracts than in Bowman (fold change 2.471). Mass spectra are given for a barley sample (c) and the standard (d).

