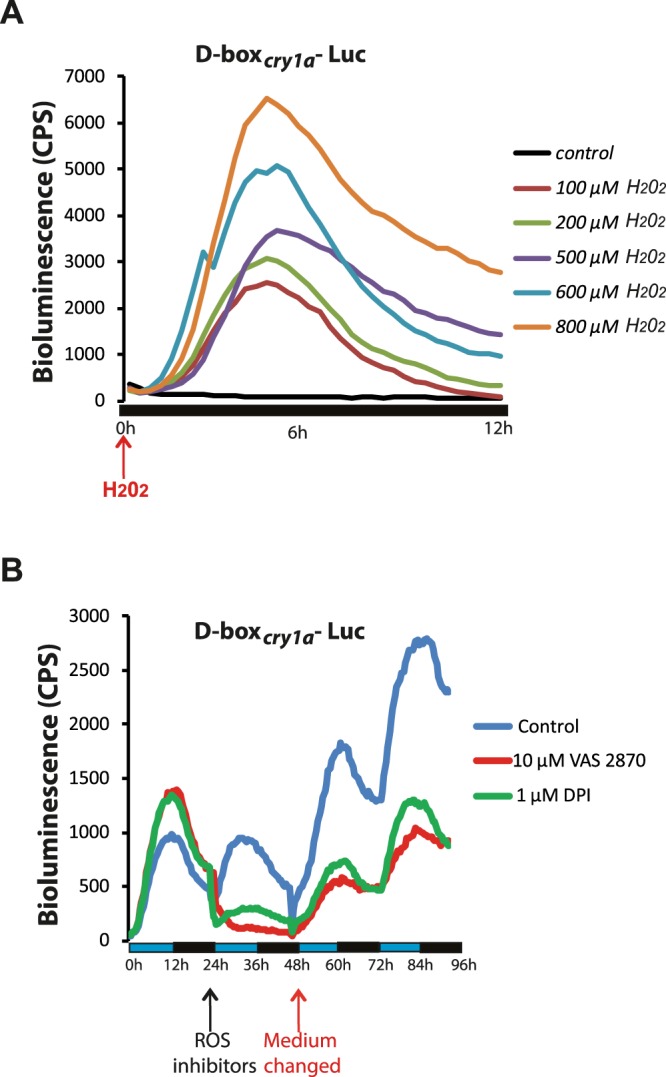
Figure 3.

Impact of H2O2 and blue light on D-box enhancer-driven gene expression in PAC-2 cells. (A) Representative real time bioluminescence assay of PAC-2 cells transfected with the D-boxcry1a-Luc reporter and treated with different concentrations of H2O2 (colour-coded traces). Black trace indicates cells treated with only the vehicle (control). (B) Representative real time bioluminescence assay of PAC-2 cells transfected with D-boxcry1a-Luc and exposed to LD cycles without (control, blue trace) or with the ROS inhibitors DPI (green trace) and VAS2870 (red trace). Means of relative bioluminescence (n = 8) are plotted on the y-axis and time on the x-axis. Vertical arrows indicate times when the inhibitors were added (black arrow) or removed (red arrow). Blue and black bars below the graphic indicate the different lighting conditions during the experiment.
