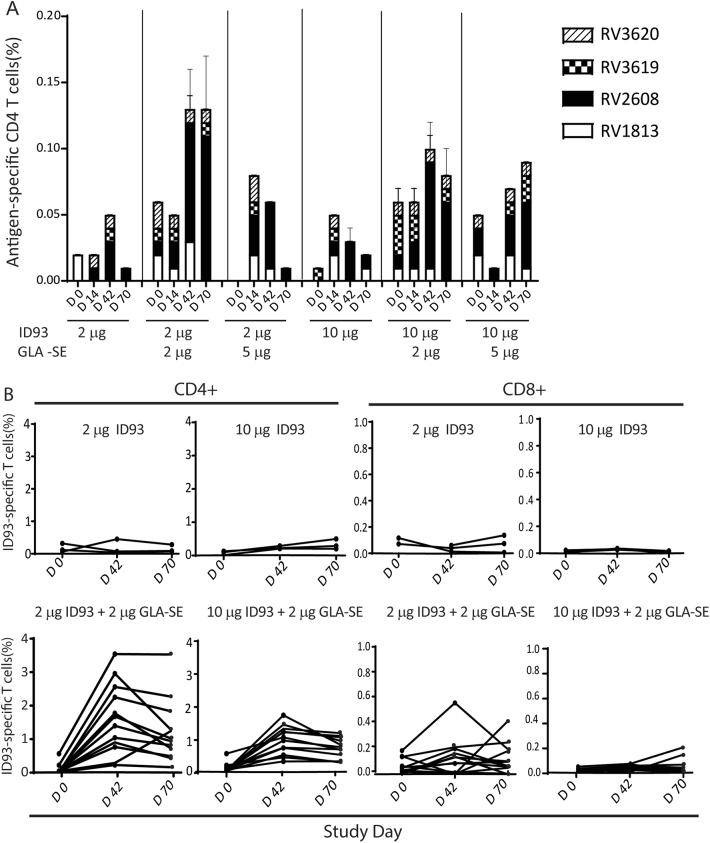
Fig. 2.
Magnitude and specificity of antigen-specific T cell response. a Kinetics of ID93 antigen-specific CD4+ T cells measured from cryopreserved PBMC at baseline and 2 weeks after each vaccination. Median frequencies of CD4+ T cells positive for any antigen-specific marker (IFNγ, TNF, IL-2, CD154, IL-4/IL-22, and/or IL-17) as measured by intracellular cytokine staining of antigen (peptide pools)-stimulated PBMCs with unstimulated values subtracted. Error bars show 95% confidence intervals. Vaccinations were administered on Days 0, 28, and 56. b Frequencies of ID93-specific (defined as positive for CD154, IFNγ, TNF, and/or IL-2) for CD4+ and CD8+ T cell responses in individual subjects as measured by intracellular cytokine staining of ID93 protein-stimulated whole blood with unstimulated values subtracted. Vaccinations were administered on Days 0, 28, and 56

