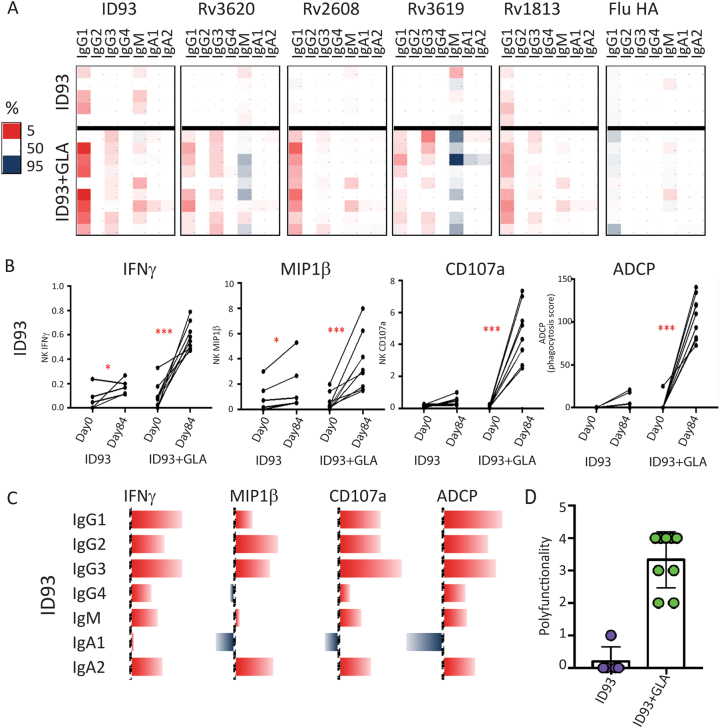
Fig. 4.
Vaccine induced antibody response profiles. a Heatmap shows changes in vaccine antigen-specific and control influenza hemagglutinin-specific antibody isotype titers after vaccination. Each row represents an individual. Each column represents an antibody isotype. The vaccine regimen is specified on the left with legend showing that red represents the top 5th percentile in the amount of change (large changes) and blue represents the 95th percentile in the amount of change (small changes). b Changes in ID93-specific antibody-dependent cellular cytotoxicity (ADCC) NK cell production of IFNγ, MIP1β, and CD107a, and antibody-dependent cellular phagocytosis (ADCP) are plotted. Each line represents each individual before (Day 0) and after (Day 84) vaccination and individuals are grouped by vaccine regimen. Statistical significance calculated by Wilcoxon matched pairs signed rank test is indicated (*p < 0.05, ***p < 0.001). c Spearman correlation coefficients between ID93 antibody-specific isotypes and ID93-specific antibody effector functions are depicted by bars with red denoting positive and blue denoting negative values. d Polyfunctionality as defined by total number of ID93-specific antibody effector functions (NK cell-mediated IFNγ, MIP1β, and CD107a, and antibody-dependent cellular phagocytosis) are graphed on a per individual basis. Each individual is represented by a dot, and individuals are grouped into vaccine regimens as noted (purple = ID93, green = ID93 + GLA-SE)

