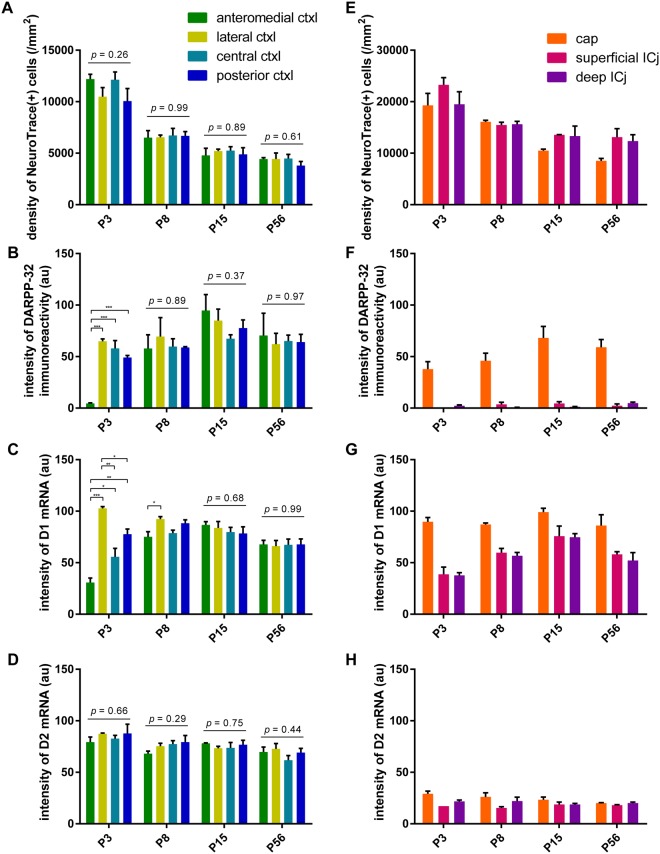
Figure 4.
Quantification of the postnatal development of the OT compartments. The OT was divided into four cortex-like domains, cap compartment, superficial Islands of Calleja (ICj), and deep ICj. In each compartment, the density of NeuroTrace (+) cells (A,E), intensity of DARPP-32 immunoreactivity (B,F), intensity of D1 mRNA signal (C,G), and intensity of D2 mRNA signal (D,H) are shown. (A–D) Quantification in cortex-like domains. (E–H) Quantification in cap compartment and ICj. Data represent the mean ± SEM. Statistical significance was calculated using one-way ANOVA with post hoc Tukey’s test to compare signal intensity among the four cortex-like domains (n = 3). *p < 0.05; **p < 0.01; ***p < 0.001.

