
Fig. 2.
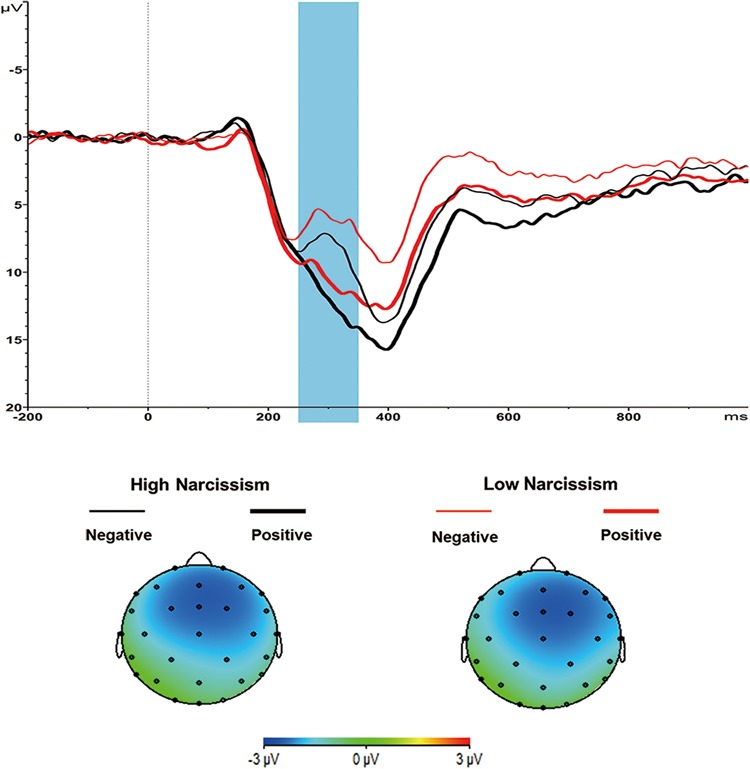
Grand-average ERPs evoked by large outcome presentation at the Fz site, where the FRN reached its maximum. The time point 0 indicates the onset of outcome presentation. The shaded blue area indicates the 250–350 ms time window for the calculation of the mean value of the FRN. The scalp topographies of the difference (Negative–Positive) for large outcomes are presented beneath.