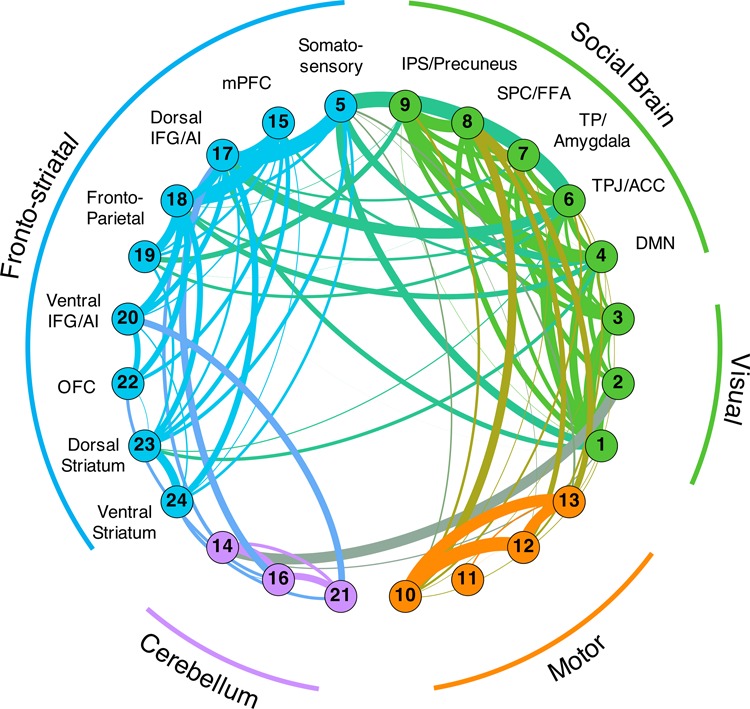
Fig. 6.

Network graphs were constructed using the ROI-specific time-series from the dual regression analysis. Components were clustered together using community detection algorithms and nodal communities are indicated by separate colors. The strength of connectivity between components is indicated by the width of the edges between them. Edge colors are a blend of the node colors that they connect. We identified four broad communities: (1) a motor cluster; (2) a cerebellum cluster; (3) a fronto-striatal cluster; (4) and a cluster of components that related to the visual system and a broad collection of components related to the social brain.
