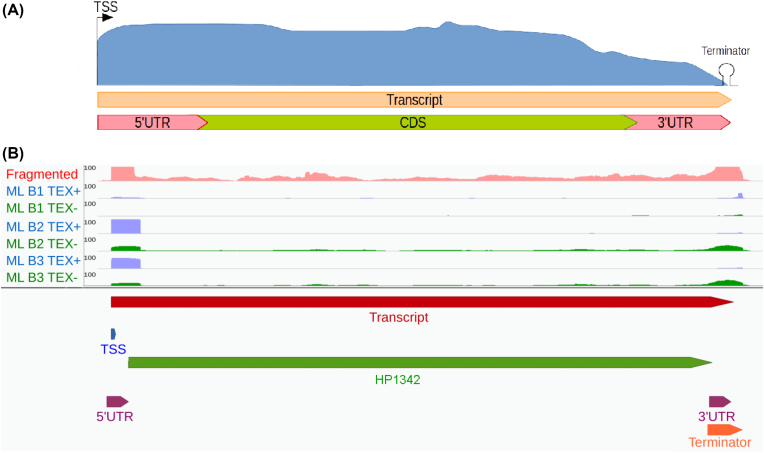
Figure 2:
Transcript boundary detection. (A) Schema: ANNOgesic can predict TSSs, terminators, transcripts, genes, and UTRs and integrate them into a comprehensive annotation. (B) Gene HP1342 of H. pylori 26695 as an example. The pink coverage plot represents RNA-seq data of libraries after fragmentation, the blue coverage plots TEX+ libraries of dRNA-seq, and the green coverage plots TEX- libraries of dRNA-seq. Transcript, TSS, terminator, and CDS are presented as red, blue, orange, and green bars, respectively. The figure shows how the transcript covers the whole gene location and how UTRs (presented by purple bars) can be detected based on the TSS, transcript, terminator, and gene annotations.

