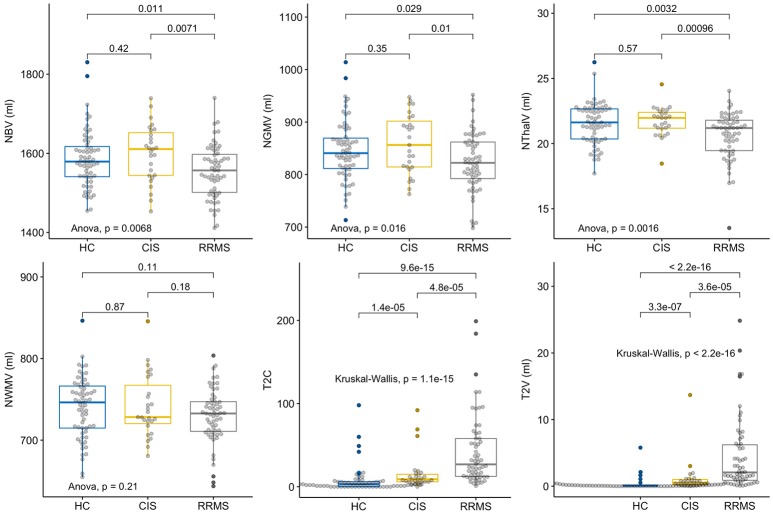
Figure 1.
Group comparisons of MRI parameters. Displayed are the respective MRI Parameters in healthy controls (HC), patients with clinically isolated syndrome (CIS) and relapsing-remitting multiple sclerosis (RRMS). The horizontal line represents the median, the box represents the upper and lower quartiles, whiskers represent the 1.5-fold IQR, outliers are encircled.

