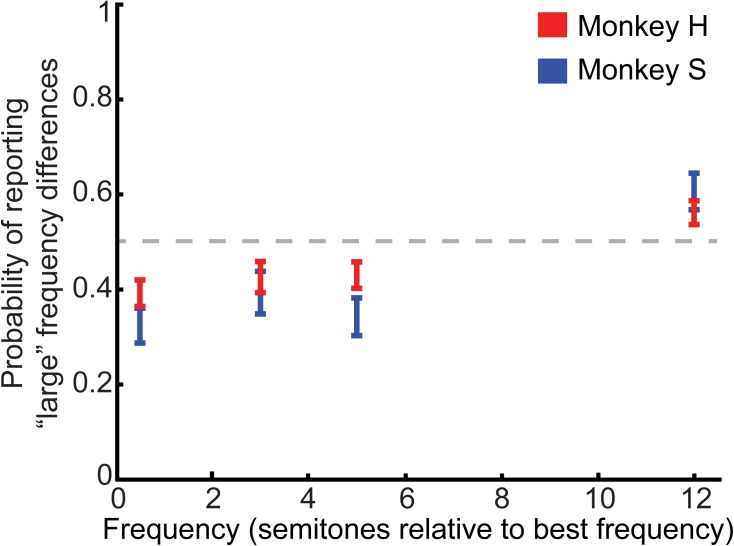
FIGURE 2.
Behavioral performance on the category task. Average psychometric performance for both monkeys is plotted as the probability that the monkeys reported a “large” frequency difference as a function of the frequency difference between the tone-A and tone-B sequences (in semitones). The center of each bar indicates average performance. The length of the bars indicates the 95%-confidence interval. The gray dashed line represents chance performance of reporting a “large” frequency difference (p = 0.5).

