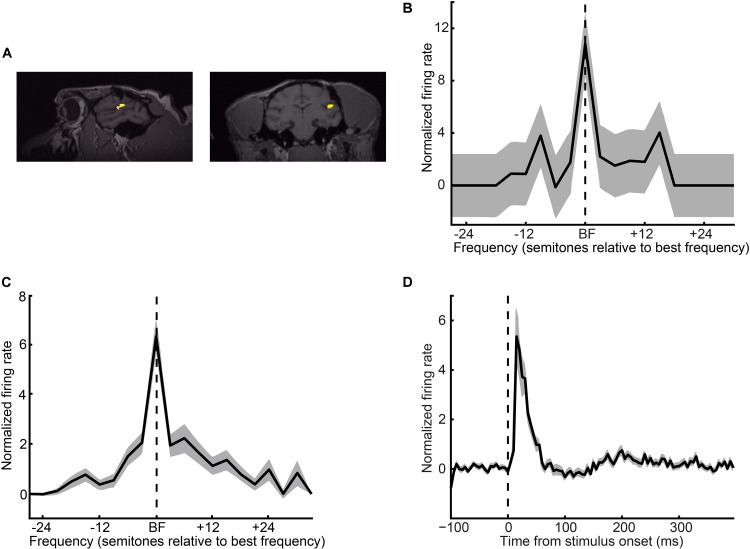
FIGURE 3.
Recording locations and A1 response properties. (A) Sagittal and coronal MRI sections of monkey H’s brain at the level of the superior temporal gyrus. The yellow regions indicate the targeted location of A1. (B) Single-neuron and (C) population frequency-response profiles. These response profiles are plotted relative to a neuron’s best frequency (BF). The vertical dotted line indicates BF. (D) Population peristimulus-time histogram. The vertical dotted line indicates tone-burst onset. For panels (B–D), firing rate is normalized relative to a baseline period of silence. Thick lines indicate mean values; shading indicates s.e.m.

