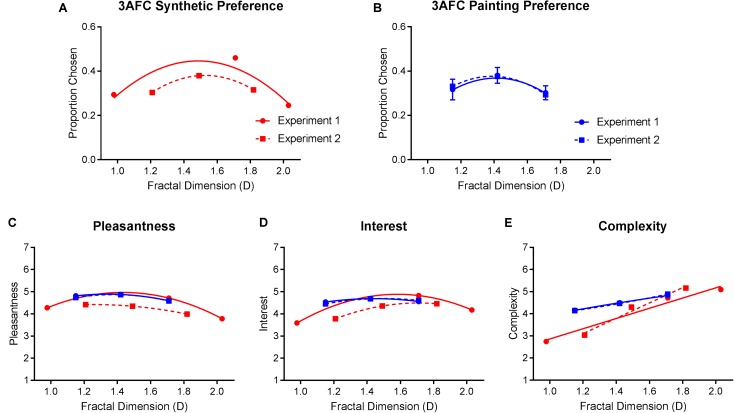
FIGURE 10.
Top row compares average (and SE) preference for (A) synthetic images and (B) paintings, across Experiments 1 and 2. Bottom graphs compare average (and SE) ratings of (C) pleasantness, (D) interest, and (E) complexity for both synthetic and painting images between the two experiments. All measures are plotted as a function of the stimuli’s fractal dimension values.

