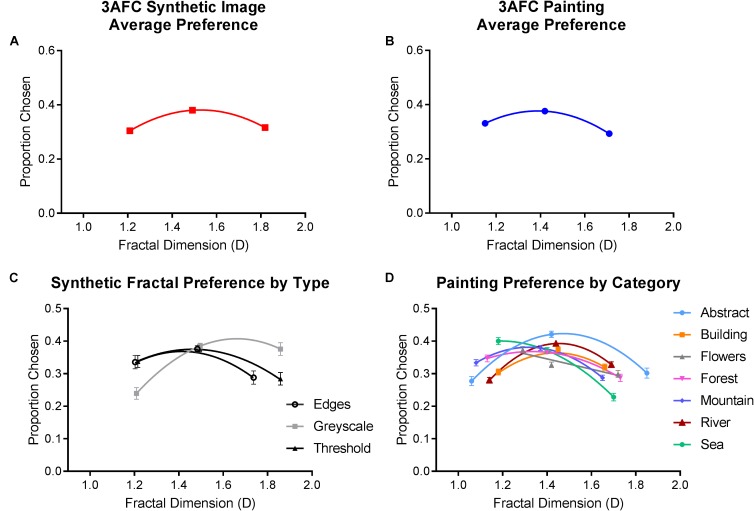
FIGURE 7.
Average preferences from Experiment 2. Top row depicts the average (and SE) proportion of times (A) synthetic and (B) painting from each level of fractal dimension were selected. Bottom row shows the average (and SE) proportion of times each category within the (C) synthetic and (D) painting image types was chosen, plotted as a function of their measured fractal dimension.

