Fig. 4.
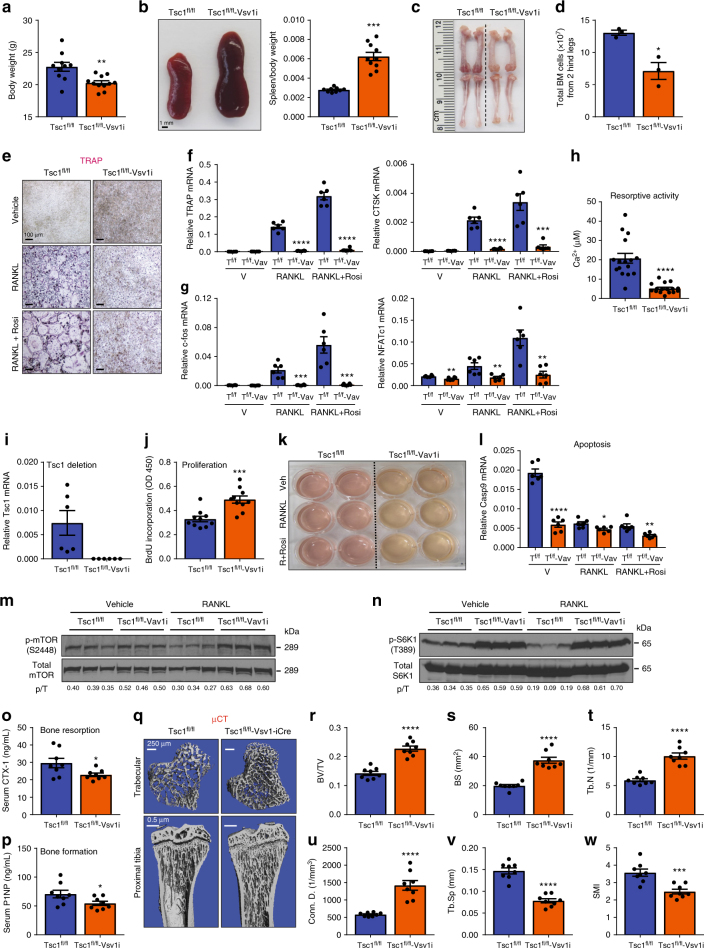
Constitutive mTORC1 activation in HSCs blunts osteoclastogenesis. Analyses of Tsc1fl/fl-Vav1-iCre cKO mice and littermate controls. a Pup body weight at 2 months old (n = 10–11). b Representative image of spleen at 2 months old (left). Quantification of spleen/body weight ratio (n = 10–11) (right). c Representative image of bone length in 2 months old pups. d Total bone marrow cells in 2 months old pups (n = 3). e Representative images of TRAP-stained osteoclast differentiation cultures. f, g Expression of osteoclast markers (f) and osteoclastogenic transcription factors (g) in bone marrow osteoclast differentiation cultures (n = 6). h Osteoclast resorptive activity measured by calcium release from bone plates (n = 16). i Tsc1 expression in bone marrow osteoclast differentiation cultures (n = 6). j Osteoclast precursor proliferation by BrdU incorporation (n = 10). k Representative image of culture media color changes in Tsc1fl/fl-Vav1-iCre cKO bone marrow cultures. l Caspase 9 expression in bone marrow osteoclast differentiation cultures (n = 6). m, n mTORC1 signaling in bone marrow osteoclast differentiation cultures 60 h after RANKL treatment. m Phosphorylation of mTOR; n Phosphorylation of S6K1. p/T ratio of phosphorylated/total protein. o Serum CTX-1 bone resorption marker (n = 8). p Serum P1NP bone formation marker (n = 8). q Representative μCT images of the trabecular bone of the tibial metaphysis (top) and the entire proximal tibia (bottom). r–w Quantification of trabecular bone volume and architecture in proximal tibiae by μCT (n = 8). r BV/TV bone volume/tissue volume ratio, s BS bone surface, t Tb.N trabecular number, u Conn. D. connectivity density, v Tb.Sp trabecular separation, w SMI structure model index. Error bars, SEM; *p < 0.05; **p < 0.01; ***p < 0.005; ****p < 0.001; n.s. non-significant. T Tsc1. Full-size scans of immunoblots are shown in Supplementary Fig. 8

