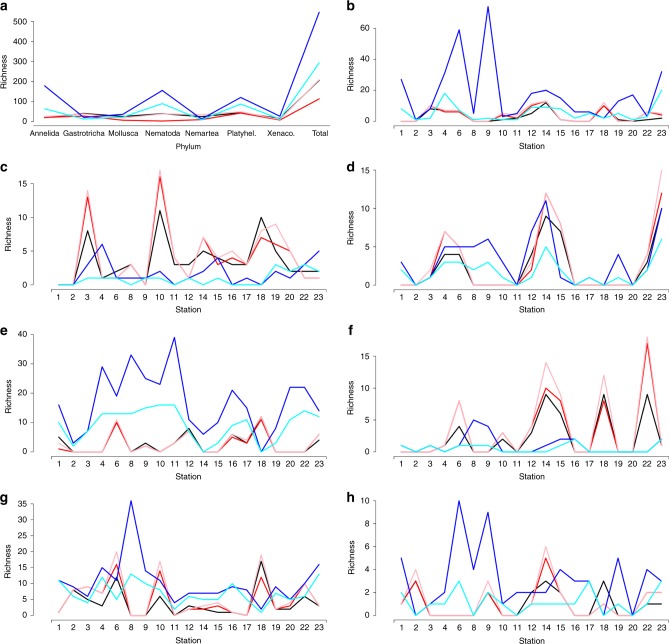
Fig. 3.
Plots showing the richness assessed via each taxonomic method. a Total richness measured in all sampled sites from each phylum. b–h Richness for each taxon at each investigated site, including Annelida (b), Gastrotricha (c), Mollusca (d), Nematoda (e), Nemertea (f), Platyhelminthes (g), and Xenacoelomorpha (h). Morphotypes (black line) are identified with comparative morphology; evolutionary independent entities (red line) are recovered via DNA taxonomy (GMYC model) from 18S rRNA sequences (V1–V2 regions) of single specimens; OTUs (pink line) recovered via 18S rRNA sequences (V1–V2 regions) of single specimens; eOTUs (dark blue line), recovered via metabarcoding 18S rRNA (V9 region); sequence variants (light blue line), recovered via metabarcoding 18S rRNA (V9 region)

