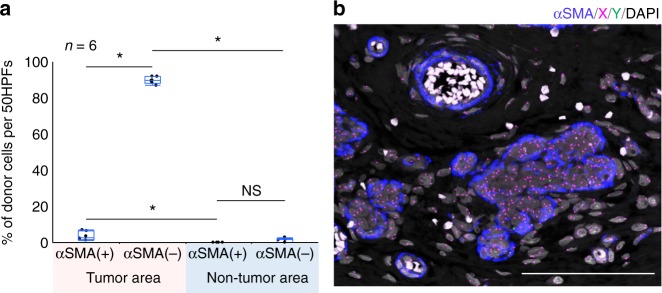
Fig. 2.
Case 1, breast carcinoma after sex-mismatched transplantation (male-to-female). a The proportion of donor SCSSNs in a region comprising 50 continuous HPFs (high-power fields, 1 HPF = 70,225 µm2) in a tumor and non-tumor area. Each analysis was carried out in six regions of two separate sections. Combined box-and-whisker and dot plots, which show medians (lines), 25th–75th percentiles (boxes), and the furthest points within 1.5× interquartile range from the box (whiskers). The interquartile range was calculated as the value in the third quartile minus that in the first quartile. The total numbers of cells were as follows: 608 αSMA(+) SCSSNs and 1533 αSMA(−) SCSSNs in the tumor area and 3 αSMA(+) SCSSNs and 359 αSMA(−) SCSSNs in the non-tumor area. *p < 0.05. NS not significant (Steel–Dwass test). b ImmunoFISH analysis of the non-tumor area. Most SCSSNs were recipient-derived. αSMA, blue; X, magenta; Y, green; DAPI, gray. Scale bar: 200 µm

