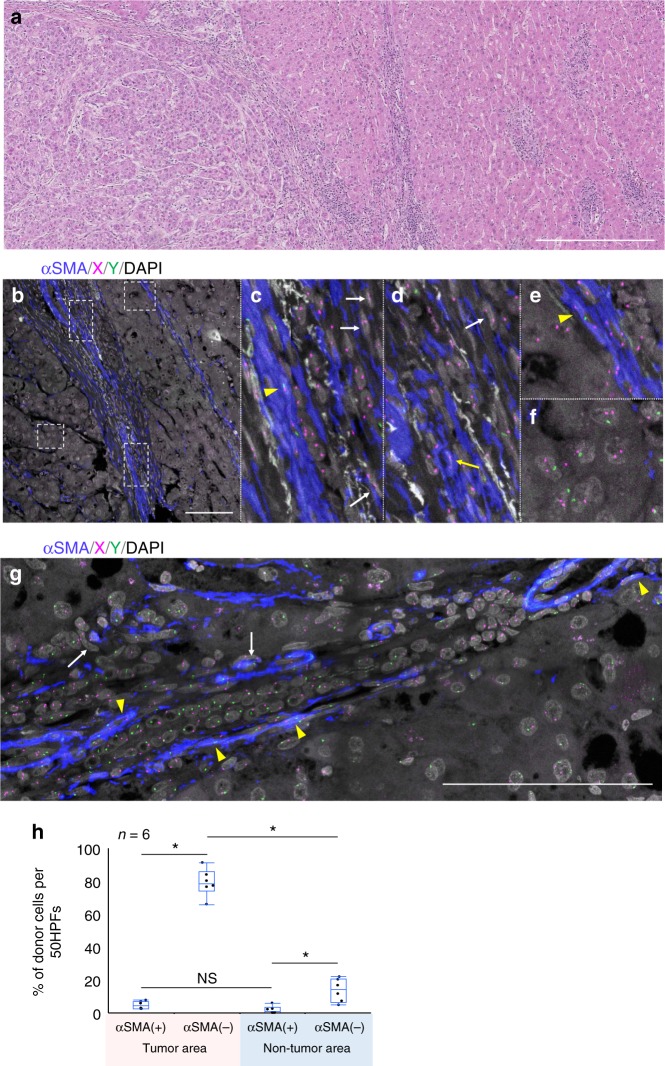
Fig. 3.
Case 2, hepatocellular carcinoma after sex-mismatched transplantation (female to male). a H&E specimen. On the left side of the picture, a hepatocellular carcinoma is observed; the non-tumor cirrhotic liver is on the right. Scale bar, 500 µm. b–f ImmunoFISH analysis of the area of the hepatocellular carcinoma. c–f Magnified images of the insets to b. Donor-derived αSMA(+) SCSSNs are indicated by yellow arrows and donor-derived αSMA(−) SCSSNs by white arrows. Recipient-derived αSMA(+) SCSSNs are indicated by yellow arrowheads. Tumor cells showing sex chromosome aneuploidy are evident in f. αSMA, blue; X, magenta; Y, green; DAPI, gray. Scale bar, 100 µm. g ImmunoFISH analysis of liver cirrhosis (non-tumor area). Donor-derived αSMA(−)SCSSNs are indicated using white arrows; recipient-derived αSMA(+) SCSSNs by yellow arrowheads. αSMA, blue; X, magenta; Y, green; DAPI, gray. Scale bar, 100 µm. h The proportions of donor SCSSNs in regions of the tumor and non-tumor areas. The analysis was carried out in six regions of three sections. The total numbers of cells analyzed were as follows: 315 αSMA(+) SCSSNs and 645 αSMA(−) SCSSNs in the tumor area and 213 αSMA(+) SCSSNs and 331 αSMA(−) SCSSNs in the non-tumor area. *p < 0.05. NS, not significant (Steel–Dwass test)

