Fig. 7.
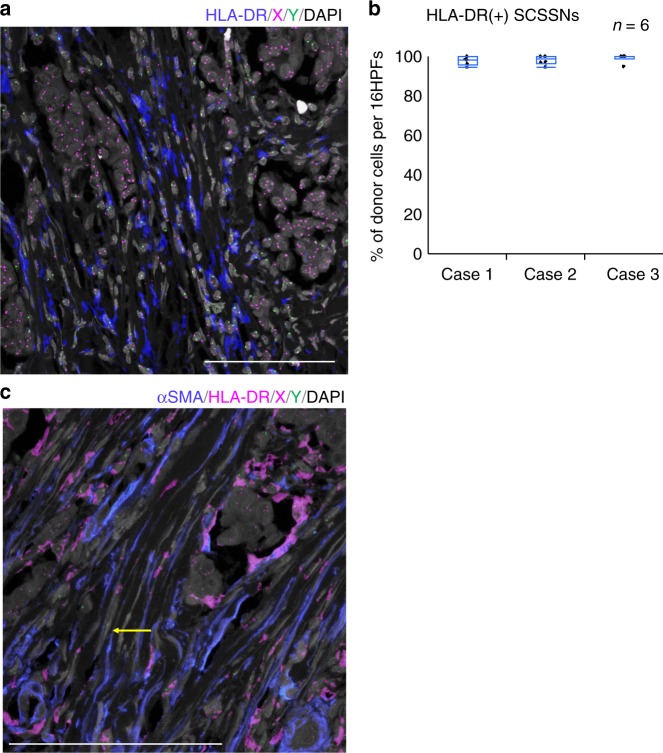
ImmunoFISH for macrophage and dendritic cell markers in case 1. a HLA-DR-immunoFISH. Most HLA-DR(+)SCSSNs originated from the donor. HLA-DR, blue; X, magenta; Y, green; DAPI, gray. Scale bar: 100 μm. b The proportions of donor cells in a region comprising 16 continuous HPFs. Each analysis was carried out in six regions of the tumor area in cases 1–3. The mean (SD, total number of HLA-DR(+) SCSSNs, number of sections) proportions of donor cells were as follows: 97.8% (2.2,% 325, 2) in case 1, 98.1% (2.3%, 156, 2) in case 2, and 99.1% (2.1%, 115, 2) in case 3. HLA-DR-immunoFISH images from cases 2 and 3 are shown in Supplementary Figures 4 and 5. c ImmunoFISH for αSMA and HLA-DR. Donor-derived αSMA(+) HLA-DR(−) SCSSNs are observed; Donor-derived αSMA(−) HLA-DR(−) SCSSN is indicated by yellow arrow. αSMA, blue; HLA-DR, magenta; X, magenta; Y, green; DAPI, gray. Scale bar, 50 μm

