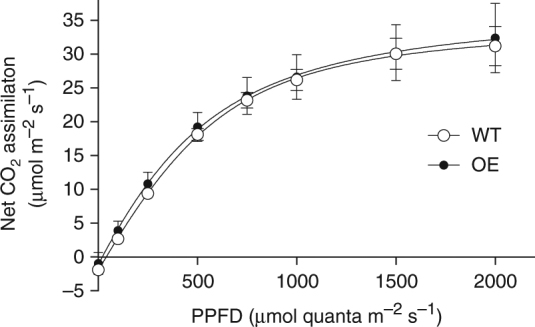
Fig. 4.

Light response curves of photosynthesis are not altered by overexpression of psbS. Light response curves of photosynthetic CO2 assimilation, combining the data for the two overexpression (OE) lines in experiment 2. Measurements were made at approximately 40 days after transplanting over a 3-day period at 30 oC, a cuvette [CO2] of 400 ppm and ambient humidity levels. Lines shown were fitted using a non-rectangular hyperbola6. Values are means ± standard errors of the means (means of measurements from individual plants from all plots), n = 4
