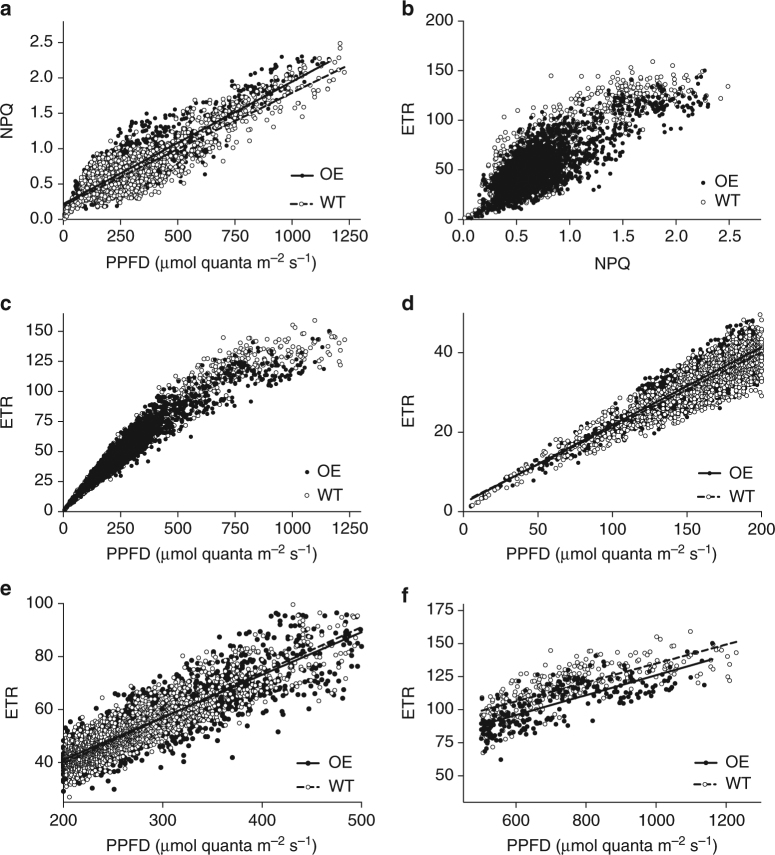
Fig. 6.
Regression analysis of chlorophyll fluorescence monitoring data show differences in electron transport rates between wild-type and psbS overexpressors. Comparisons between NPQ, relative electron transport rate (ETR) and PPFD (photosynthetic photon flux density) using all of the Monitoring Pam data collected over a 14-day period up to the formation of leaf 9 on the main stem in experiment 2. Single measurements shown (wild-type (WT) and the two overexpressing (OE) lines). Two sensors were used for WT measurements and one each for the two OE lines, changing plant every 3 days. Data from experiment 2. These data were used in a regression model (Table 1 and Supplementary Table 1) to show significant differences in the relationship between NPQ, ETR and PPFD for OE and WT lines. Here, we highlight key differences by separating each portion of the curve and showing linear regression lines for a the entire NPQ vs. PPFD response, d the linear light-limited portion of the ETR vs. PPFD response (0–200 µmol m−2 s−1), e the intermediate portion (200–500 µmol m−2 s−1) of the ETR vs. PPFD response and f the high region of the ETR vs. PPFD response ( > 500 µmol m−2 s−1). The intermediate PPFD range e shows the transition between the low range (where ETR is higher in the OE) and the high range (where ETR is higher in the WT). Slopes (WT and OE, respectively) are a 0.001591 and 0.001729, d 0.1881 and 0.1963, e 0.1713 and 0.1608, f 0.07155 and 0.07526. We point out that these lines are for the purpose of statistical analysis only and have not been forced through zero. They cannot, for example, be used as a direct calculation of quantum yield

