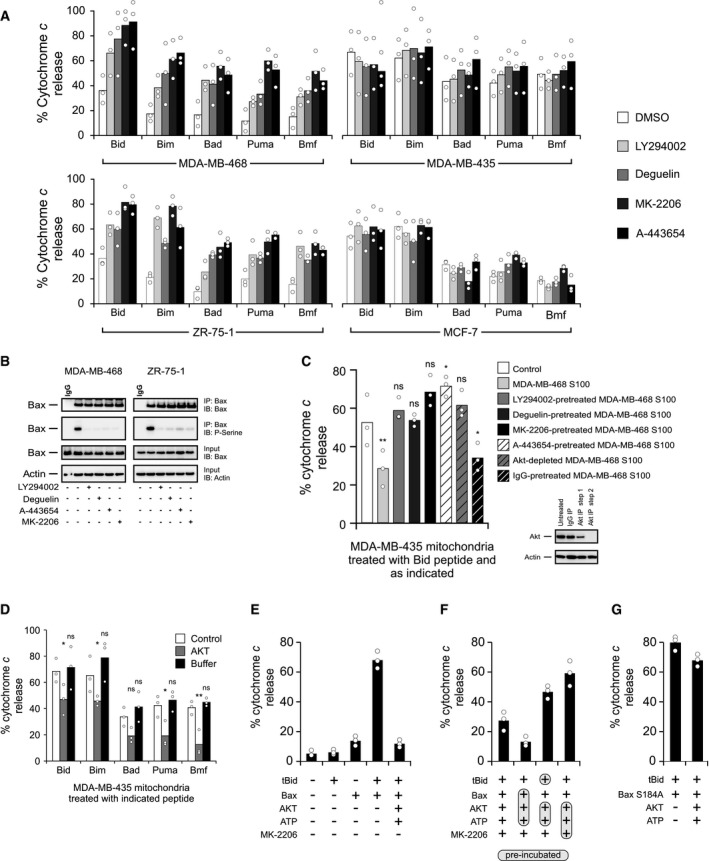
Figure 3. AKT phosphorylates and inhibits Bax, preventing mitochondrial cytochrome c release in response to BH3 peptides and proteins.

- BH3‐peptide‐resistant (left panels; MDA‐MB‐468 and ZR‐75‐1) and BH3‐peptide‐sensitive (right panels; MDA‐MB‐435 and MCF‐7) cells were treated with direct Akt inhibitors (MK‐2206 [1 μM], A‐443654 [0.4 μM]) or Akt pathway inhibitors (LY294002 [25 μM], deguelin [10 nM]) for 6 h, and BH3 profiles were analyzed. The phosphatase inhibitor cocktail PhosSTOP was used in all buffers for these experiments. Cytochrome c release was determined by ELISA. Bars indicate the mean of three independent experiments (n = 3). Symbols indicate the mean of at least two technical replicates for each independent experiment. Two‐way ANOVA was conducted on the influence of two independent variables (BH3 peptide, drug) on cytochrome c release of isolated mitochondria for each cell line followed by post hoc t‐tests with Bonferroni correction for multiple comparisons. Each drug treatment was statistically compared to DMSO control within each peptide treatment group. The percentage of P‐values that were significant (DMSO control to each drug) was 65% for MDA‐MB‐468, 0% for MDA‐MB‐435, 95% for ZR‐75‐1, and 0% for MDA‐MB‐435. See Appendix Table S1 for P‐values of each comparison.
- Top two panels: MDA‐MB‐468 and ZR‐75‐1 cells were treated with 1 μM MK‐2206, 0.4 μM A‐443654, 25 μM LY294002, or 10 nM deguelin where indicated. Phosphorylation of Bax was evaluated using lysates from the treated cells by Western blotting with the indicated antibodies (IB) after immunoprecipitation with the indicated antibodies (IP). Lower two panels: 5%–10% of the total lysates (input) were probed for Bax and actin as expression and loading controls, respectively, by Western blotting with the indicated antibodies (IB). Bax ∆21 antibody was used for both IP and IB of Bax.
- S100 fractions from untreated cells (MDA‐MB‐468) or from cells treated with direct Akt inhibitors (MK‐2206 [1 μM], A‐443654 [0.4 μM]) or Akt pathway inhibitors (LY294002 [25 μM], deguelin [10 nM]) were isolated. Akt was immunodepleted by sequential immunoprecipitation of untreated S100 fractions, and the efficiency of immunodepletion was tested by immunoblot analysis. IgG was used as a negative control for immunodepletion experiments (inset). Indicated S100 fractions were incubated with MDA‐MB‐435 mitochondrial preparations, and the resulting extent of priming was assessed by measuring the cytochrome c released from MDA‐MB‐435 mitochondria by Bid BH3 peptide (treatments with Bim, Bad, Puma, and Bmf are located in Fig EV2B). Cytochrome c release was determined by ELISA. The phosphatase inhibitor cocktail PhosSTOP was used in all buffers for these experiments. Bars indicate the mean of three independent experiments (n = 3). Symbols indicate the mean of at least two technical replicates for each independent experiment. Two‐way ANOVA was conducted on the influence of two independent variables (BH3 peptide, conditions) on cytochrome c release of isolated mitochondria followed by post hoc t‐tests with Bonferroni correction for multiple comparisons. Each condition was statistically compared to control (white bar) within each peptide treatment group. Shown here are P‐values for treatment with Bid BH3 peptide (ns = not significant). MDA‐MB‐468 S100 (**P = 0.0031), A443654‐pre‐treated MDA‐MB‐468 S100 (*P = 0.0324), and IgG‐pre‐treated MDA‐MB‐468 S100 (*P = 0.0432). See Appendix Table S2 for P‐values.
- MDA‐MB‐435 mitochondria were incubated with recombinant active Akt in kinase assay buffer containing ATP, and alteration of priming in MDA‐MB‐435 mitochondria was detected by using BH3 profiling. Cytochrome c release was determined by ELISA. The phosphatase inhibitor cocktail PhosSTOP was used in all buffers for these experiments. Bars indicate the mean of three independent experiments (n = 3). Symbols indicate the mean of at least two technical replicates for each independent experiment. Two‐way ANOVA was conducted on the influence of two independent variables (BH3 peptide, treatment) on cytochrome c release. BH3 peptides included Bid, Bim, Bad, Puma, and Bmf. Treatment included Akt or buffer alone. Each drug treatment was statistically compared to control (white bar) within each peptide group using t‐tests with Bonferroni correction for multiple comparisons (ns = not significant). Bid, Akt (*P = 0.0283); Bim, Akt (*P = 0.0482); Puma, Akt (*P = 0.0170); Bmf, Akt (**P = 0.0035).
- tBid (5 nM) and Bax (50 nM), with or without active Akt plus ATP, were incubated with mitochondria isolated from Bax−/− Bak−/− DKO MEFs for 1 h, and mitochondrial cytochrome c release was determined by ELISA. Bars indicate the mean of three independent experiments (n = 3). Symbols indicate the mean of at least two technical replicates for each independent experiment.
- tBid, Bax, Akt, ATP, and the Akt inhibitor MK‐2206, as indicated, were incubated with mitochondria isolated from Bax−/− Bak−/− DKO MEFs for 1 h, and mitochondrial cytochrome c release was determined by ELISA. The shaded and circled reagents were pre‐incubated before the addition of the other indicated reagents. Bars indicate the mean of three independent experiments (n = 3). Symbols indicate the mean of at least two technical replicates for each independent experiment.
- tBid (5 nM) and Bax S184A (50 nM), with or without active Akt plus ATP, were incubated with mitochondria isolated from Bax−/− Bak−/− DKO MEFs for 1 h, and mitochondrial cytochrome c release was determined by ELISA. Bars indicate the mean of three independent experiments (n = 3). Symbols indicate the mean of at least two technical replicates for each independent experiment.
