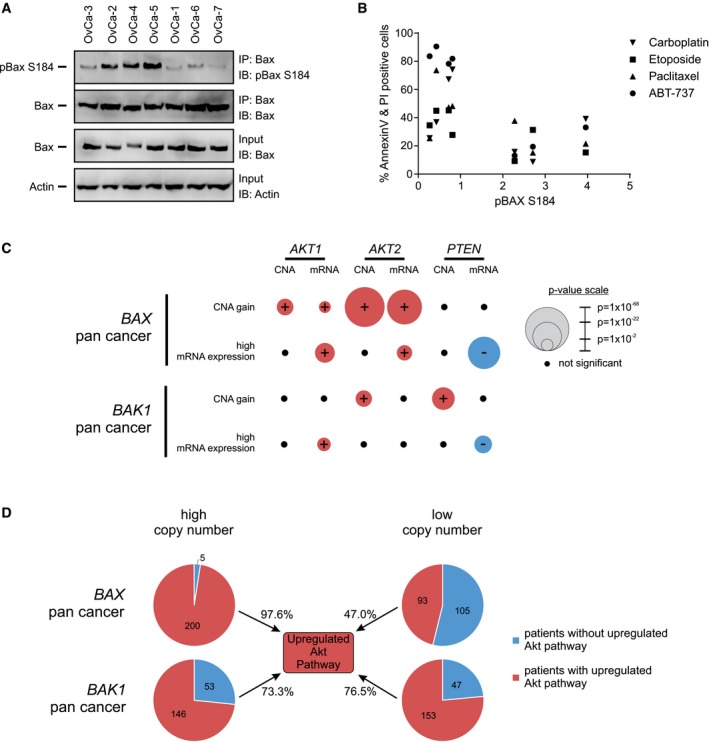
Figure 6. S184‐phosphorylated Bax is correlated with ABT‐737 resistance in primary ovarian cancer cells, while overexpression of Bax is countered by Akt pathway activation in human cancers.

- S184‐phosphorylated Bax is correlated with ABT‐737 resistance in primary ovarian cancer cells. Phosphorylation of Bax S184 was evaluated using lysates from the indicated primary ovarian cancer cells by Western blotting with the indicated antibodies (IB) after immunoprecipitation with the indicated antibodies (IP) (left panel). 5–10% of the total lysates (input) were probed for Bax (Bax ∆21 antibody) and actin as expression and loading controls, respectively, by Western blotting with the indicated antibodies (IB).
- To evaluate apoptotic response in primary ovarian cancer cells, cells from each OvCa cell line indicated in Fig 6A were treated with either carboplatin (100 μM), etoposide (50 μM), paclitaxel (0.1 μM), and ABT‐737 (0.5 μM) for 48 h, and apoptotic cells were evaluated by Annexin V/PI staining and flow cytometry (right panel). Apoptotic response to each drug was plotted against the pBaxS184/Bax ratio (calculated from Fig 6A) for each primary ovarian cancer sample. Correlation between pBaxS184 and response to drug treatment was evaluated two‐tailed Spearman correlation. Only ABT‐737 resistance was significantly (P < 0.05) correlated with pBax S184 levels. Symbols indicate the mean of two experimental repeats (n = 2), each having two technical repeats for each of the seven OvCa cell lines treated with the indicated drug.
- TCGA database of all human cancers was probed for significant associations between the row heading (e.g., BAX CNA gain) and copy number (CNA) gain/loss (red/blue) or mRNA up/downregulation (red/blue) of the indicated genes (AKT1, AKT2, and PTEN). Association strength is proportional to −log(P‐value), reflected in the radii of the circles. Black circles indicates non‐significant association (P‐value cutoff = 0.02). The data used to generate this figure are located in Appendix Table S3.
- Each circle represents the total number of patients, across all cancers in the TCGA database, with either high BAX or BAK1 (higher than the mean, left) or low BAX or BAK1 (lower than the mean, right) copy number. Within each circle, the proportion of patients with upregulated Akt pathway (red) is compared to the proportion of patients without upregulated Akt pathway (blue). Upregulated Akt pathway is defined as an increase in AKT1 or AKT2 or PIK3CA or decrease in PTEN copy number.
