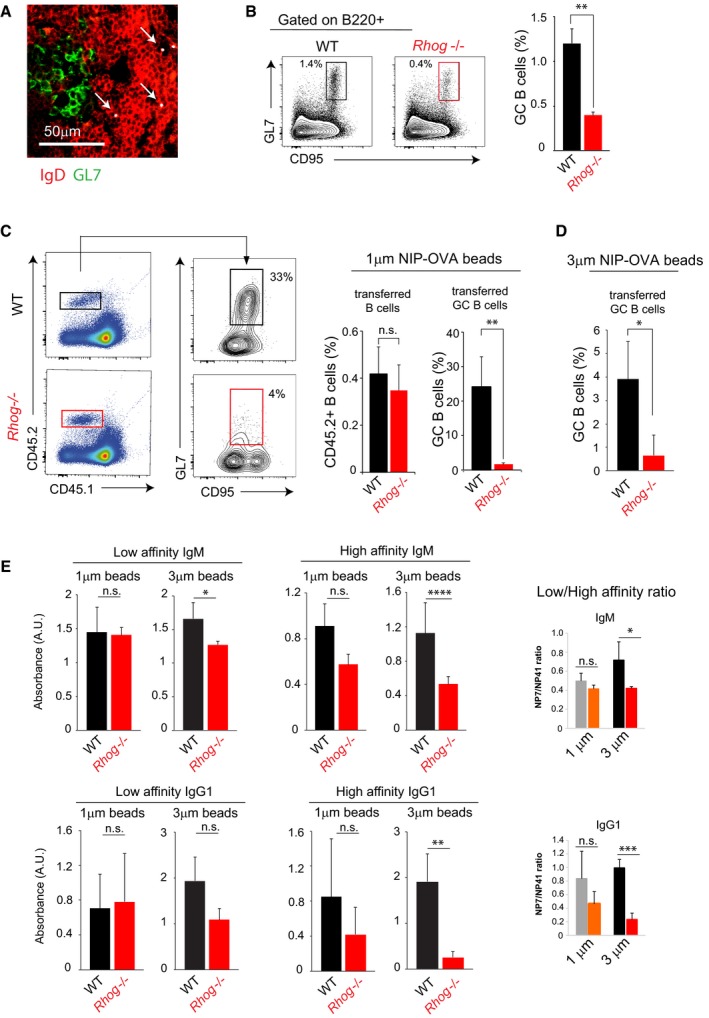
Figure 3. Antigen phagocytosis by B cells is important for the germinal center response.

- Confocal image of spleen sections of WT mice 5 days post‐immunization with NIP‐OVA bound to 1 μm fluorescent beads. IgD (red); GL7 (green); 1 μm fluorescent beads (gray). White arrows point FO B cells (IgD+) with beads. Representative image of 3 GCs per spleen section and per immunized mouse (n = 6 mice).
- Analysis of germinal center B cells (CD95+ GL7+) in WT and Rhog −/− mice 7 days post‐immunization with 1 μm beads covalently coated with NIP‐OVA. The bar graph shows the mean percentage ± SEM of CD95+ GL7+ B cells (n = 3). **P < 0.005 (unpaired Student's t‐test).
- WT and Rhog −/− B1‐8hi CD45.2 B cells were adoptively transferred to congenic CD45.1 receptor mice immunized with 1 μm beads covalently bound to NIP‐OVA. The flow cytometry panel illustrates germinal center B cells (CD95+ GL7+) within the transferred WT (upper panel) or Rhog −/− (lower panel) B cells (CD45.2+ CD45.1−). Quantification charts show the percentage of transferred B cells (CD45.2+ B220+) and GC B cells (CD95+ GL7+). Data represent means ± SEM (n = 3). **P < 0.005 (unpaired Student's t‐test).
- Quantification chart of the percentage of germinal center B cells within the WT and Rhog −/− B1‐8hi CD45.2 B cells adoptively transferred to congenic CD45.1 receptor mice, as in (C), and immunized with 3 μm beads covalently bound to NIP‐OVA. Data represent means ± SEM (n = 6). *P < 0.05 (unpaired Student's t‐test).
- WT and Rhog −/− mice were immunized with 1 and 3 μm beads covalently bound with NIP‐OVA. Sera were collected after 14 days and high‐affinity NP(7) and low‐affinity NP(41)‐specific IgM (upper graphs) and IgG1 (lower graphs) were measured by ELISA. Graphs show means ± SEM (n = 4) as well as the ratios of absorbance for NP(7) vs. NP(41) binding. n.s. P > 0.05; *P < 0.05; **P < 0.005; ***P < 0.0005; ****P < 0.00005 (unpaired Student's t‐test).
