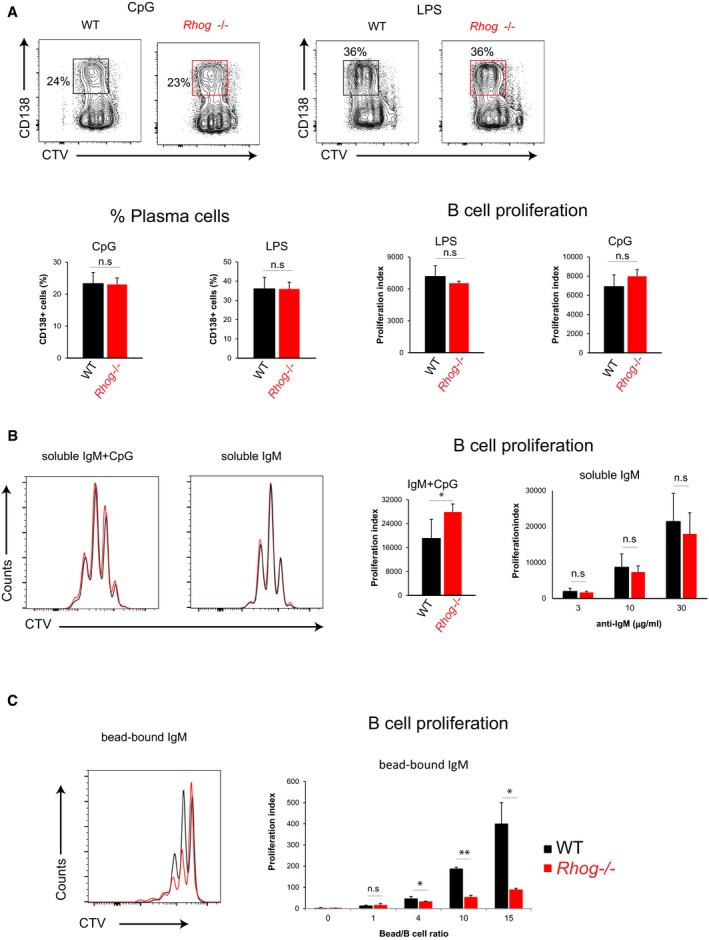
Figure EV4. Rhog −/− B cells show normal proliferation and plasma cell differentiation upon TLR and BCR soluble stimulation but not to a particulate BCR‐stimulation.

-
AIn vitro plasma cell differentiation (CD138+) obtained after 3 days of stimulation of Cell Trace Violet‐stained WT and Rhog −/− B cells with 1 μg/ml CpG or 1 μg/ml LPS in the presence of IL‐4 and IL‐5. Bar graphs show the means ± SEM of plasma cell (PC) percentages (CD138+ IgD−) and the proliferation index (n = 3).
-
B, CCTV‐B cells from WT and Rhog −/− mice were stimulated for 3 days with anti‐IgM (5 μg/ml) + CpG (1 μg/ml), soluble anti‐IgM (3, 10, 30 μg/ml) (B), or bead‐bound anti‐IgM (4:1, 10:1, 15:1 ratio beads:B cell) in the presence of IL‐4 and IL‐5 (C). Histogram plots of CTV‐ B cells from WT and Rhog −/− mice after the different stimulations. Quantification charts show the proliferation index (n = 3). Data shows means ± SEM.
