

Abstract
The electronic and molecular structures of the lithium and sodium complexes of 1,4‐bis(2,6‐diisopropylphenyl)‐2,3‐dimethyl‐1,4‐diazabutadiene (Me2DADDipp) were fully characterized by using a multi‐frequency electron paramagnetic resonance (EPR) spectroscopy approach and crystallography, together with density functional theory (DFT) calculations. EPR measurements, using T 1 relaxation‐time‐filtered pulse EPR spectroscopy, revealed the diagonal elements of the A and g tensors for the metal and ligand sites. It was found that the central metals in the lithium complexes had sizable contributions to the SOMO, whereas this contribution was less strongly observed for the sodium complex. Such strong contributions were attributed to structural specifications (e.g. geometrical data and atomic size) rather than electronic effects.
Keywords: alkali metals, diazadiene ligands, EPR spectroscopy, relaxation filters, spin population
1. Introduction
1,4‐Diaza‐1,3‐dienes (DADs) are well established as highly versatile ligands for nearly every element in the periodic table.1, 2, 3 The list of stable DAD complexes encompasses main‐group metals,4, 5, 6, 7, 8, 9, 10, 11, 12, 13, 14, 15, 16, 17, 18, 19 early20, 21, 22, 23, 24, 25, 26, 27, 28, 29, 30, 31, 32, 33, 34, 35 and late36, 37, 38, 39, 40, 41, 42, 43, 44, 45, 46, 47 transition metals, as well as the lanthanides and actinides.48, 49, 50, 51, 52, 53, 54, 55, 56, 57, 58, 59, 60, 61 Important practical applications of metal diazadiene complexes include homogeneous catalysis,36, 37, 40, 62, 63, 64, 65, 66, 67, 68, 69, 70 C−H bond activation,39, 41, 42 materials science,71, 72 and the synthesis of single‐molecule magnets.73 A unique electronic property of 1,4‐diaza‐1,3‐dienes is that they are redox non‐innocent and can undergo one‐ and two‐electron reduction steps to afford the corresponding radical anions and the enediamide dianions, respectively, as shown in Scheme 1.1, 2, 3
Scheme 1.
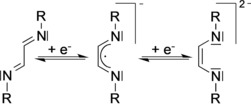
Stepwise reduction of 1,4‐diaza‐1,3‐dienes to give the corresponding radical anions and enediamide dianions.
This electronic flexibility in addition to the possibility of tuning the steric properties of DADs by using various substituents at both the C and N atoms account for the high versatility of DAD ligands in coordination chemistry. Scheme 2 shows the different coordination modes of DAD ligands that have been reported in the literature.1, 2, 3, 4, 5, 6, 7, 8, 9, 10, 11, 12, 13, 14, 15, 16, 17, 18, 19, 20, 21, 22, 23, 24, 25, 26, 27, 28, 29, 30, 31, 32, 33, 34, 35, 36, 37, 38, 39, 40, 41, 42, 43, 44, 45, 46, 47, 48, 49, 50, 51, 52, 53, 54, 55, 56, 57, 58, 59, 60, 61, 62, 63, 64, 65, 66, 67, 68, 69, 70, 71, 72, 73
Scheme 2.
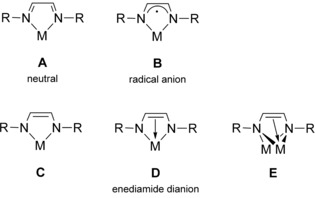
Known coordination modes of 1,4‐diaza‐1,3‐diene ligands.
Most common in combination with late transition metals, especially in their low oxidation states, is the neutral κN,κN′‐chelating mode. Both dianionic enediamide derivatives and κ2‐coordinated radical‐anion complexes are known for various s‐, p‐, and d‐block metals and the first‐row transition metals. However, nonchelating coordination modes are also possible,56 but well‐characterized examples are exceedingly rare.
Although radicals of heavy main elements and transition metals with DAD ligands have received significant interest in the past decades,1, 2, 3, 74, 75, 76, 77, 78, 79 there are fewer studies on group 1 metal complexes of these ligands.80, 81 Electron paramagnetic resonance (EPR) spectroscopy is excellently suited for investigating paramagnetic metal complexes and radicals produced in chemical and biological processes. It provides a model of the radical structure and maps the wave function of the unpaired electron by the g tensor and hyperfine couplings (A tensor). The so‐far‐reported EPR spectroscopy results on DAD complexes have mostly indicated that the unpaired electron is delocalized over the DAD backbone, and therefore, a dominant ligand‐centered character with small g and A anisotropies is generated. However, there are other cases that report weak or rather strong delocalization into metal centers in addition to the DAD backbone.1, 2, 3, 4, 14, 18, 19, 74, 75, 76, 82, 83
Technically, for cases in which the spin density is distributed between more than one paramagnetic center (organic radicals, metal complexes, or clusters), overlapping of the hyperfine spectra of different species is expected. This is a common case in EPR spectroscopy and is especially observed for biological systems.84, 85 However, there are several methods to solve this problem, including exploitation of the field‐dependent increase in resolution of the g tensor, nutation experiments, and the application of the electron‐Zeeman‐resolved EPR method.86, 87, 88 Another way employs the temperature dependence of the relaxation times in time domain EPR spectroscopy techniques.88, 89, 90, 91 Different paramagnetic species show different relaxation behaviors, especially at low temperatures. The spin‐lattice relaxation time constant, T 1, is known as an intrinsic property of paramagnetic centers. It is strongly structure dependent and cannot easily be changed.92 As a result, it can be used as a magnetic marker of the individual paramagnetic species.
Here, both continuous‐wave (CW) and pulsed EPR techniques in combination with DFT calculations were applied to elucidate the electronic structure of the title complexes (as shown in Scheme 3) and to obtain information on the magnetic properties of the individual alkali metal centers. The concept of measuring temperature‐dependent spin‐lattice relaxation times (T 1) and applying a filter time to separate different species was used. For the first time, we report anisotropy of the g and A tensors of lithium‐ and sodium‐based radicals stabilized in combination with DAD ligands.
Scheme 3.
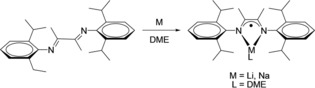
Preparation of the title compounds Li(Me2DADDipp)(dme) and Na(Me2DADDipp)(dme).
2. Results and Discussion
The title compounds were prepared according to Scheme 3 by treatment of the readily accessible DAD precursor 1,4‐bis(2,6‐diisopropylphenyl)‐2,3‐dimethyl‐1,4‐diazabutadiene (Me2DADDipp) with lithium or sodium metal in an exact molar ratio of 1:1. It was necessary to avoid any excess amount of the alkali metal to prevent over‐reduction and the formation of dianionic enediamide species (see Scheme 1).
Li(Me2DADDipp) and Na(Me2DADDipp) crystallize from 1,2‐dimethoxyethane (DME) as the corresponding solvated complexes Li(Me2DADDipp)(dme) and Na(Me2DADDipp)(dme), respectively. The molecular structure of Li(Me2DADDipp)(dme) in the crystal is closely related to the DFT‐optimized structure of Li(Me2DADDipp), and the Li atom lies in the Me2C2N2 plane of a chelating Me2DADDipp ligand (Figure 1). Coordinative saturation of the Li atom is achieved by a chelating DME ligand. Thereby, the environment of the metal atom is almost square planar instead of a more usual tetrahedral arrangement (angle between LiN2 and LiO2 plane is 18–35°; the range results from disorder of the DME ligand). This finding can most likely be traced back to the steric bulk of the isopropyl groups perpendicular to the Me2C2N2 plane, which force the DME ligand into the plane. Na(Me2DADDipp)(dme) is isotypic with Li(Me2DADDipp)(dme), but the crystal quality did not allow for full structure refinement.
Figure 1.
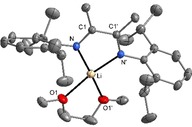
Molecular structure of Li(Me2DADDipp)(dme) in the crystal. The dme ligand and one isopropyl group are disordered over two orientations; only one orientation is shown. Displacement ellipsoids are drawn at the 30 % probability level, and hydrogen atoms are omitted for clarity. Symmetry code: ′1+x, −1+y, 1−z. The crystal structure of Na(Me2DADDipp)(dme) is isotypic.
The geometrical parameters of the DAD backbone (−NHC=CHN−) obtained from the crystal structure analysis show a shortened C1−C1′ bond [1.448(5) Å] and an elongated C1−N bond length of 1.329(3) Å for Li(Me2DADDipp)(dme). The values for the free Me2DADDipp ligand are reported as 1.498(3) Å for C−C and 1.279(3)/1.280(3) Å for C−N.92 The corresponding data obtained from the DFT calculations show a C−C bond length of 1.43 Å and a C−N bond length of 1.34 Å, both of which are in good agreement with the experimental data. These structural data are indicative of the radical character of the ligand among the several possible coordination modes of the DAD ligands (see Scheme 2).1, 2, 3, 20 The calculated Li−N bond length of 1.90 Å is significantly shorter than the experimental value of 2.032(5) Å. The longer Li−N bonds in the crystal structure are most likely due to the increased coordination number of Li by the addition of the DME ligand.
The experimental Li−N distance is similar to the values observed for related lithium complexes.18, 80, 93 In view of the fact that the M−N bonds are shorter in the lithium complexes than in the sodium analogues, it is to be supposed that the lithium atom has a closer spatial proximity to the DAD ligand backbone than sodium. Because of lithium's orbital overlapping with the ligand‐based orbitals containing unpaired electron density (the so‐called SOMO, singly occupied molecular orbital), lithium can significantly contribute to delocalization of the SOMO. As a result, we expect to observe the signature of a lithium‐centered unpaired electron spin population in the EPR spectra as well.
Following the same line of arguments, sodium, due to its bigger size, is more distant from the DAD ligand. Therefore, orbital overlap is reduced, and consequently, it contributes less to the SOMO. Another possible explanation for the hyperfine splitting on the metal site is the position of the aryl groups with respect to the DAD plane (see Figure 2).
Figure 2.
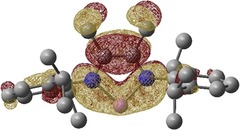
Gas‐phase‐optimized SOMO of the Li(Me2DADDipp) structure at the UB3LYP/DZ(p) level of theory, shown at the 0.02 a.u. contour level. Lithium is shown in pink and nitrogen atoms are shown in blue. Hydrogen atoms are omitted for clarity.
Inspection of the dihedral angle shows that it has a value of 102.1(3)° in the crystal structure (calculated as 103.1°) with respect to the DAD plane. Therefore, the aryl groups can have a partial but rather weak contribution to the SOMO through their electron‐donating character . The corresponding dihedral angle in the sodium complex is approximately 99°, which is indicative of limited delocalization to the SOMO compared to the lithium complex. The corresponding coordinates of the fully optimized structures of Li(Me2DADDipp) and Na(Me2DADDipp) are given in Tables S1 and S2 in the Supporting Information.
Well‐resolved CW‐EPR spectra of the Na(Me2DADDipp) complex were obtained at room temperature at both the X‐ and Q‐band frequencies (9.4 and 34 GHz microwave frequency). Temperature variation resulted in no significant differences in the spectra at the Q‐band frequencies. At the X‐band, the EPR spectra were recorded down to a temperature of 193 K. The corresponding spectra are given in Figures S1–S3.
Simulation of the room‐temperature spectrum at the X‐band frequency revealed a slight non‐equivalency of the methyl protons, a set of two protons with 0.57 mT and the remaining four with a splitting of 0.55 mT. The a iso(14N), for two equivalent nitrogen atoms, and a iso(23Na) were found to be 0.53 and 0.1 mT, respectively (see Table 1). Although the hyperfine coupling of the sodium is small, it is responsible for the spectral line shapes. The same set of parameters was used to simulate the Q‐band spectrum at room temperature. The experimental spectrum recorded at 9.4 GHz and its simulation are shown in Figure 3. The corresponding Q‐band spectrum and its simulation are shown in Figure S4.
Table 1.
Experimental hyperfine splittings and g‐values for the title complexes.
| Complex | Solvent | T [K] | g(x,y,z) | M [a] | Hyperfine coupling [mT] | |
|---|---|---|---|---|---|---|
| 14N | 1H | |||||
| Na(Me2DADDipp) | THF | 298 | 2.005 | 0.10 | 0.53 | 0.57, 0.55 |
| 2.005 | ||||||
| 2.005 | ||||||
| 20 | 2.009 | 3.50 | 2.50 | – | ||
| 2.006 | 1.70 | 1.00 | – | |||
| 2.003 | 0.30 | 0.35 | – | |||
| Li(Me2DADDipp) | THF | 20 | 2.192 | 20.30 | 2.50 | – |
| 2.026 | 4.20 | 1.00 | – | |||
| 1.997 | 2.80 | 0.30 | – | |||
| Li(Me2DADDipp) | toluene | 20 | 1.192 | 21.00 | 2.50 | – |
| 2.026 | 1.70 | 2.50 | – | |||
| 1.99 | 0.30 | 2.50 | – | |||
[a] M: Metal: Li or Na.
Figure 3.
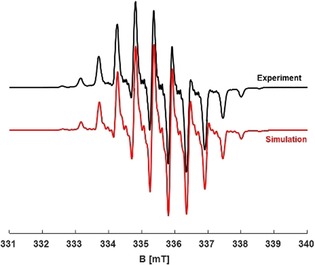
Experimental room‐temperature CW‐EPR spectrum of Na(Me2DADDipp) in THF (—) and the simulated spectrum (—) at 9.4 GHz revealed a iso(14N)=0.53 mT(#2), a iso(1H)=0.57, 0.55 mT (#2, #4), and a iso(23Na)=0.1 mT at g iso=2.005.
For the sodium Me2DADDipp complex, calculation of the hyperfine couplings also substantiated the description of a delocalized spin distribution over the backbone of the ligand and to a lesser extent also on the metal site. The calculated spin populations showed that about 1.3 % of the total spin resided on the sodium pz orbital. Each nitrogen atom of the ligand backbone carries about 27.6 % of the total spin population. Six methyl protons of the ligand backbone with an average value of 0.53 mT together with a 0.39 mT hyperfine coupling of the two equivalent nitrogen atoms were calculated. This is in good agreement with the current experiment and with typical proton and nitrogen couplings reported for different metal complexes with DAD ligands.18, 19 As compared to the lithium complex, a slightly larger coupling of 0.3 mT was obtained for sodium, but this value is still in the range of previously reported experimental findings. The isotropic g‐value was calculated to be 2.003, which is consistent with the experimental isotropic g‐value of 2.005 at room temperature.
At the Q‐band frequencies, the CW‐EPR measurements of Li(Me2DADDipp) in toluene showed a signal centered at about g=2.00. Although the spectral shape changed upon varying the temperature, this signal was preserved at all measured temperatures at the same field position. By cooling down to 20 K, the appearance of two other signals at roughly g=2.02 and 1.97 mT was observed (Figure 4).
Figure 4.
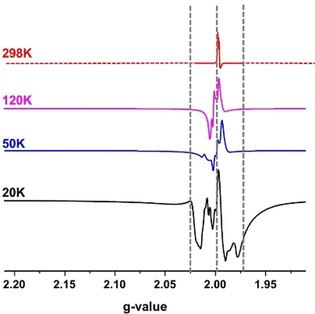
Q‐band CW‐EPR spectra of Li(Me2DADDipp)(dme) in toluene recorded at different temperatures. Two new features are observable at about g=2.02 and 1.97, as described in the text. The three dashed lines show the positions of the newly raised species.
Calculation of the hyperfine splittings for the solvent‐free‐optimized structure of the Li(Me2DADDipp) complex (see Figure 2) showed rather similar results: six equivalent protons with a iso(1H)=0.54 mT, two equivalent nitrogen atoms with a iso(14N)=0.32 mT, and an a iso(6,7Li)=0.2 mT. The isotropic g‐value was calculated as 2.003. The nitrogen atoms of the ligand backbone were found to have slightly lower spin populations (≈25 % each) whereas the lithium spin population increased to about 3 %. These results are in good agreement with the experimentally reported values for other Li(Me2DADDipp) complexes at room temperature.93
Measurement of the Li(Me2DADDipp)(dme) complex at the X‐band and at room temperature was not possible due to the much stronger interaction of the lithium complex with the magnetic field within the X‐band frequency range, which made it impossible to tune and set up the experiment properly.
Due to the complexity of the CW‐EPR spectra of the lithium complex and the presence of signals that manifest themselves at different temperatures, we aimed to obtain more information about the magnetic properties of the individual nuclei (of the metal and ligand) by applying pulsed EPR techniques at the X‐band frequencies. The electron spin echo (ESE)‐detected spectra of both Li‐DAD complexes were broad (≈100 mT spread width) and anisotropic; this is the typical spectral hyperfine splitting pattern of an I=3/2 nuclear spin species. Additionally, the g‐value obtained from the spectrum in its maximum field position (≈322–327 mT at different solvents) was in the range of around g=2.03 to 2.05, which is suggestive of an inorganic radical. This confirmed the presence of spin distribution on lithium at temperatures of both 20 and 50 K.
In the case of Li(Me2DADDipp)(dme) dissolved in toluene at 50 K, we observed a shoulder (slightly more pronounced at 50 K than at 20 K) at a field position of about 331.4 mT. Simulation of the ESE spectrum at 20 K showed strong anisotropy (gxx=2.192, gyy=2.026, gzz=1.997) and a splitting of about 21.0 mT related to the metal site. The ligand site could be simulated with two equivalent nitrogen atoms with a splitting of about 2.5 mT (see Figure S5 and Table S2). Applying relaxation filters with filter times of 5.8 μs (at 20 K, see Figure 5 a) and 2.1 μs (at 50 K) suppressed the metal species, and we clearly observed that only the second species (organic radical‐ligand‐centered) appeared at 329.1 mT at 20 K (Figure 5 b) and at 331.4 mT at 50 K. By integrating the area under the full and filtered ESE spectra, we found that about 15 % of the second species (organic ligand‐centered) contributed to the overall spectrum, which is also consistent with spectral simulation of the unfiltered spectrum.
Figure 5.
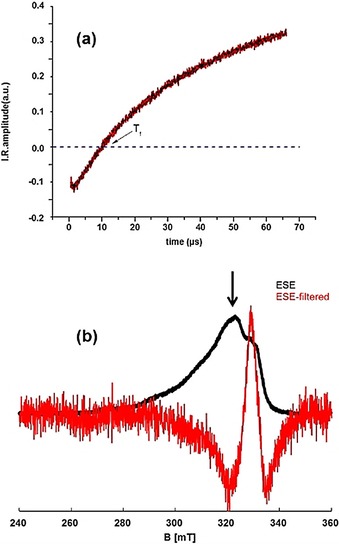
a) Inversion recovery (IR) trace (—) and its fit (—). The obtained filtering time from the zero crossing point is 5.8 μs. b) Field swept EPR spectra of Li(Me2DADDipp)(dme) dissolved in toluene recorded before (—) and after (—) filter time (T f) application. The arrow shows the used field position for the IR trace. All measurements were done at 20 K.
As for the Li(Me2DADDipp)(dme) complex dissolved in THF, the presence of a 3/2 nuclear spin system was observable, especially at an optimum temperature of 30 K. The second species (organic‐ligand‐centered) was clearly present at a field position about 337 mT. There was significant anisotropy in both the A and g tensors in both species, that is, those centered at the lithium and nitrogen (two equivalent) nuclei. The ESE spectrum could be simulated by using the same g‐values as those found for the Li complex dissolved in toluene but with a smaller spin population on the metal site, that is, reduced hyperfine coupling A(6,7Li)=[20.3 4.2 2.8] mT. The ligand‐centered species with two nitrogen atoms of couplings A(14N)=[2.5 1.0 0.3] mT could be simulated (Table 1, Figure S6).
Upon comparison to the complex dissolved in toluene and by inspection of the A tensor values, a spin distribution on the metal and ligand was clearly observed in THF as the solvent. By changing the solvent, higher spin populations were shifted towards the molecular y direction in the coordination plane. This effect was attributed to THF molecules attached to lithium in the coordination plane, as by dissolving the complex in THF, the original dme ligand was replaced by one or two THF ligands. The integrated full and filtered ESE spectra, upon comparing with those of the complex dissolved in toluene, revealed a slightly higher contribution (≈5 %) of the ligand‐centered species, which was also verified by simulating the spectra (see Figures S6–S8). It is possible that the spin population was delocalized to the coordinated solvent molecule (16O is EPR silent and the natural abundance of 17O is only ≈0.04 %), and therefore, the observed change in the spin distribution could be explained by the change in the solvent. Conducting a relaxation‐filtered hyperfine (REFINE) experiment on the sample confirmed the presence of spin population on lithium.
The magnitude spectrum (which shows the presence of certain nuclei in a sample on the basis of their nuclear Larmor frequency) revealed a signal at 6.1 MHz, which is consistent with the nuclear Larmor frequency of lithium at the used field position (Figure S9). The ESE spectrum of the sodium complex dissolved in THF at first sight did not show significant anisotropy or broadening. In fact, this spectrum had a narrow width of about 7.5 mT. Moreover, the obtained g‐value at maximum field position was g=2.006, which was indicative of an organic radical. Typical g‐values of nitrogen‐based radicals94, 95, 96 were used to simulate the organic ligand component (Figure S10).
Applying a relaxation filter with appropriate filter times (3.2 and 4.6 μs at 50 and 20 K, respectively), obtained from the T 1 measurements, did not seem to result in any large differences between the full and filtered ESE upon varying the temperature. However, at closer inspection of the spectra another spectral species was observable at 20 K with broad anisotropy of about 40 mT (see Figure 6); this signal was attributed to the metal‐centered species. Integration of the area under the spectra revealed a contribution of about 40 % from the metal‐centered species at 50 K and a contribution of about 55 % at 20 K. A distributed spin population on the nitrogen and sodium nuclei was also observed by a REFINE experiment (Figures S11 and S12).
Figure 6.
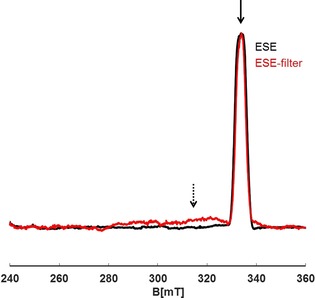
Field swept spectra of Na(Me2DADDipp)(dme) dissolved in THF recorded before (—) and after (—) filter time (T f) application. The black arrow shows the field position used for the IR trace. The metal (Na)‐centered contribution to the spectrum and its broad range are still observed (dotted arrow) by applying the corresponding filter time. Spectra were recorded at 20 K.
3. Conclusions
We present the preparation and characterization of the lithium and sodium complexes of the Me2DADDipp ligand by EPR spectroscopy and crystallography in combination with DFT calculations. Application of pulsed EPR spectroscopy provided detailed information on the electronic structures of these complexes. Significant delocalization of the SOMO to the metal site was observed for the lithium complex.
Such an effect was also observed for the sodium complex, but to a much lesser extent. The reason for such a noticeable contribution from the metal site was attributed to structural specifications (e.g. geometrical parameters, atom size) rather than the electronic nature of the substituents attached to the Me2DADDipp ligand (i.e. electron‐donating or electron‐withdrawing groups). On the basis of the findings on the size dependency of the metal‐site contribution, it was derived that elements in the alkali‐metal group that are bigger in size, such as the radical structures of Cs+ and Rb+, would mainly consist of ligand‐centered contributions. Indeed, it was found that radicals of Cs+– and Rb+–diamine complexes adopted a ligand‐centered nature.81, 98
Investigation of the measured T 1 values indicated that such short relaxation times led to no significant intermolecular dipolar coupling at low or high temperatures. Therefore, a change in the electronic ground state of the complex (singlet to triplet transition) was ruled out. In fact, we could not detect a signal at the half‐field position, which would be indicative of a triplet state.
Experimental Section
General
All operations were performed under an inert argon atmosphere by using standard dry box and Schlenk techniques. Solvents were dried according to common procedures and were distilled under an argon atmosphere prior to use. The Me2DADDipp starting material was prepared according to a published procedure93 Lithium and sodium metals were obtained from commercial sources. They were freed from paraffin oil by washing with n‐pentane and were stored in a dry box. IR spectra were measured with an ATR IR spectrometer Bruker Vertex V70. Mass spectra (EI, 70 eV) were recorded with a MAT 95 apparatus. Microanalyses of the compounds were performed by using a Leco CHNS 932 apparatus.
Syntheses
Li(Me2DADDipp)(dme): Lithium (35 mg, 5 mmol) was added to a solution of Me2DADDipp (2.0 g, 4.9 mmol) in DME (100 mL). The mixture was stirred at RT with a glass‐coated stirring bar until all the lithium was consumed, and the mixture was then filtered. The deep‐red filtrate was concentrated in vacuo to approximately 30 mL. Crystallization at 5 °C yielded Li(Me2DADDipp)(dme) (2.2 g, 88 %) as deep‐red crystals: m.p. 135 °C. IR (ATR): =3050 (w), 2957 (s), 2868 (m), 1655 (w), 1594 (m), 1547 (w), 1511 (w), 1452 (s), 1428 (s), 1393 (vs), 1316 (s), 1244 (vs), 1205 (m), 1151 (m), 1117 (m), 1065 (s), 1029 (m), 1016 (m), 978 (m), 933 (w), 862 (m), 811 (w), 779 (s), 750 (m), 733 (m), 666 (w), 627 (w), 583 (w), 541 (w), 438 cm−1 (m); MS (EI): m/z (%): 406 (42) [Me2DADDipp+2 H], 361 (95) [Me2DADDipp−C3H7], 202 (100) [Me2DADDipp−C14H20N], 188 (20), 172 (18), 160 (67), 144 (22), 91 (25); elemental analysis calcd (%) for C32H50LiN2O2 (501.69): C 76.61, H 10.05, N 5.58; found: C 76.58, H 10.22, N 5.64.
Na(Me2DADDipp)(dme): Sodium (115 mg, 5 mmol) was added to a solution of Me2DADDipp (2.0 g, 4.9 mmol) in DME (100 mL). The mixture was stirred at RT with a glass‐coated stirring bar until all the sodium was consumed, and the mixture was then filtered. The deep‐red filtrate was concentrated under vacuum to a black oil. n‐Pentane (20 mL) was added to the dark oil, and the solution was mixed well before it was kept at 5 °C to yield Na(Me2DADDipp)(dme) (1.2 g, 47 %): m.p. 130 °C. IR (ATR): =3062 (w), 2957 (s), 2927 (m), 2867 (m), 1662 (s), 1631 (m), 1590 (m), 1522 (s), 1464 (m), 1438 (s), 1382 (m), 1363 (s), 1321 (m), 1253 (m), 1206 (m), 1182 (m), 1121 (s), 1102 (m), 1057 (m), 1042 (m), 984 (m), 933 (m), 904 (s), 882 (s), 860 (s), 820 (m), 792 (vs), 781 (m), 762 (m), 738 (m), 716 (m), 688 (m), 622 (m), 526 (m), 465 (m), 428 (m), 412 cm−1 (m); MS (EI): m/z (%): 406 (18) [Me2DADDipp+2 H], 361 (100) [Me2DADDipp−C3H7], 202 (99) [Me2DADDipp−C14H20N], 186 (40), 172 (44), 160 (84), 144 (50), 133 (26); elemental analysis calcd (%) for C32H50N2NaO2 (517.74): C 74.23, H 9.73, N 5.41; found: C 74.69, H 9.26, N 5.48.
EPR Sample Preparation
EPR tubes with an outer diameter of 3 mm were filled with the metal–Me2DADDipp complexes at a concentration 0.5 mm under a N2 or argon atmosphere. The 3 mm EPR tubes were sealed to prevent redox reactions with water and oxygen in the air. Li(Me2DADDipp)(dme) was dissolved in toluene and in THF. In the case of Na(Me2DADDipp)(dme), THF was used as the solvent. For low‐temperature measurements, filled EPR tubes were vitrified by using precooled methylbutane before the measurements.
EPR Instrumental Details
Q‐band CW‐EPR (33.9 GHz) measurements were conducted with a Bruker EMX‐plusQ spectrometer by using an ER5106QT resonator. Microwave powers between 1 and 0.1 mW (20–30 dB) were used for Na(Me2DADDipp)(dme), whereas the best results were obtained at a power of 0.1 mW for Li(Me2DADDipp)(dme). Unless otherwise noted, a modulation amplitude of 0.7 mT was used during the measurements. The modulation frequency was set to 100 kHz. A temperature series of 298, 150, 100, 50, and 20 K were measured for Na(Me2DADDipp)(dme) and Li(Me2DADDipp)(dme) (dissolved in toluene).
X‐Band (9.43 GHz) room‐temperature CW‐EPR measurements were performed with a Magnettech MiniScope MS400 benchtop spectrometer. Spectra were recorded with a microwave power of 1.0 mW, a modulation frequency of 100 KHz, a modulation amplitude of 0.05 mT, and 4096 points.
X‐band (≈9.4 GHz) pulsed EPR measurements were performed with a Bruker Elexsys E580 spectrometer equipped with an MS3 114 resonator. The pulses were amplified by a 1 kW pulsed traveling wavetube (TWT) amplifier. Field swept (Electron Spin Echo‐ESE) T 1 relaxation measurements and relaxation‐filtered ESE were recorded at 20 and 50 K. ESE spectra were obtained with the conventional two‐pulse echo sequence ( ) (for which the echo intensity is monitored as a function of the magnetic field). To obtain relaxation times T 1, the typical inversion recovery (IR) sequence of the filtered ESE ( ) was employed. A two‐step phase cycle was used to remove the unwanted echoes. Relaxation‐filtered hyperfine (REFINE) spectroscopy83, 84 was also applied to obtain at least a qualitative picture of the paramagnetic species present in the sample. For REFINE measurements, a pulse sequence of ( ) together with a four‐step phase cycle84, 85 were used. Filter times (T f) were obtained by fitting the relaxation curves with a biexponential function (as implemented in OriginPro 8.0) and finding the zero crossing point. For all pulses, a 16 ns pulse length was used, and for pulses, a 32 ns pulse length was applied.
A closed cycle cryostat (ARS‐ 4WH, www.arscryo.com) was used to cool down to 20 K during the measurements.
MATLAB 8.60 (The MathWorks, Inc., Natick, MA, USA) was used for baseline correction of the EPR spectra. REFINE time traces were processed by using a home‐written MATLAB code. They were first baseline corrected (using a stretched exponential function) and then apodization with a Hamming window and zero filling were applied. Finally, Fourier transformation provided the magnitude spectra. All simulations were performed by using the Easyspin program package in MATLAB.99 Nuclei natural abundancies were used throughout the simulations.
Computational Details
Geometry optimization of the Me2DADDipp complexes was performed by using density functional theory (DFT) by using the ORCA 3.0.3 software package developed by Neese100 at the UB3LYP/DZ(P) level of theory.101, 102, 103 As the THF and toluene solvents are among the group of low dielectric media and did not have a large influence on the optimized structures, only the gas‐phase‐optimized structures are reported. The optimized structures were then checked for having imaginary frequencies, which indicated if the structure was in a true minimum on the potential‐energy surface. It turned out that both structures were real minimum‐energy structures. Hyperfine splittings and g‐values were then calculated at thePBE0/TZVP104, 105 level. The reported proton splittings are averaged values due to free rotation of the methyl protons at room temperature. For other nuclei, the isotropic hyperfine values (a iso) are given.
X‐ray Crystallography
The single‐crystal X‐ray diffraction data of Li(Me2DADDipp)(dme)106 were collected with a Stoe IPDS 2T diffractometer with graphite‐monochromated MoKα radiation. The structures were solved by direct methods (SIR‐97)107 and were refined by full‐matrix least‐squares methods on F 2 by using SHELXL‐2016/4.108 The Crystallographic Information Files (CIF) are part of the Supporting Information.
Conflict of interest
The authors declare no conflict of interest.
Supporting information
As a service to our authors and readers, this journal provides supporting information supplied by the authors. Such materials are peer reviewed and may be re‐organized for online delivery, but are not copy‐edited or typeset. Technical support issues arising from supporting information (other than missing files) should be addressed to the authors.
Supplementary
Acknowledgements
General support of this work by the Otto‐von‐Guericke‐Universität Magdeburg and the Martin‐Luther‐Universität Halle‐Wittenberg is gratefully acknowledged. We thank Franziska Zeuner and Heike Schimm for technical support with the EPR measurements. This work was supported by the European Regional Development Fund (ERDF) and the Federal State of Saxony‐Anhalt (H.H.H and D.H.).
H. H. Haeri, R. Duraisamy, N. Harmgarth, P. Liebing, V. Lorenz, D. Hinderberger, F. T. Edelmann, ChemistryOpen 2018, 7, 701.
Contributor Information
Prof. Dr. Dariush Hinderberger, Email: dariush.hinderberger@chemie.uni-halle.de.
Prof. Dr. Frank. T. Edelmann, Email: frank.edelmann@ovgu.de
References
- 1. van Koten G., Vrieze K., Adv. Organomet. Chem. 1982, 21, 151–239. [Google Scholar]
- 2. Vrieze K., J. Organomet. Chem. 1986, 300, 307–326. [Google Scholar]
- 3. Mealli C., Ienco A., Phillips A. D., Galindo A., Eur. J. Inorg. Chem. 2007, 2556–2568. [Google Scholar]
- 4. Thiele K.-H., Lorenz V., Thiele G., Zoennchen P., Scholz J. J., Angew. Chem. Int. Ed. Engl. 1994, 33, 1372–1373; [Google Scholar]; Angew. Chem. 1994, 106, 1461–1463. [Google Scholar]
- 5. Clyburne J. A. C., Culp R. D., Kamepalli S., Cowley A. H., Decken A., Inorg. Chem. 1996, 35, 6651–6655. [DOI] [PubMed] [Google Scholar]
- 6. Mair F. S., Manning R., Pritchard R. G., Warren J. E., Chem. Commun. 2001, 1136–1137. [Google Scholar]
- 7. Baker R. J., Farley R. D., Jones C., Kloth M., Murphy D. M., Chem. Commun. 2002, 1196–1197. [DOI] [PubMed] [Google Scholar]
- 8. Baker R. J., Davis A. J., Jones C., Kloth M., J. Organomet. Chem. 2002, 656, 203–210. [Google Scholar]
- 9. Baker R. J., Jones C., Kloth M., Mills D. P., New J. Chem. 2004, 28, 207–213. [Google Scholar]
- 10. Baker R. J., Jones C., Murphy D. M., Chem. Commun. 2005, 1339–1341. [DOI] [PubMed] [Google Scholar]
- 11. Yang X.-J., Yu J., Liu Y., Xie Y., Schaefer H. F., Liang Y., Wu B., Chem. Commun. 2007, 2363–2365. [DOI] [PubMed] [Google Scholar]
- 12. Yu J., Yang X.-J., Liu Y., Pu Z., Li Q.-S., Xie Y., Schafer H. F., Wu B., Organometallics 2008, 27, 5800–5805. [Google Scholar]
- 13. Hinchcliffe A., Mair F. S., McInnes E. J. L., Pritchard R. G., Warren J. E., Dalton Trans. 2008, 222–233. [DOI] [PubMed] [Google Scholar]
- 14. Jones C., Stasch A., Woodul W. D., Chem. Commun. 2009, 113–115. [DOI] [PubMed] [Google Scholar]
- 15. Liu Y., Li S., Yang X.-J., Yang P., Wu B., J. Am. Chem. Soc. 2009, 131, 4210–4211. [DOI] [PubMed] [Google Scholar]
- 16. Panda T. K., Kaneko H., Michel O., Pal K., Tsurugi H., Törnroos K. W., Anwander R., Mashima K., Organometallics 2012, 31, 3178–3184. [Google Scholar]
- 17. Lorenz V., Hrib C. G., Grote D., Hilfert L., Krasnopolski M., Edelmann F. T., Organometallics 2013, 32, 4636–4642. [Google Scholar]
- 18. Zhao Y., Liu Y., Wang Z., Xu W., Liu B., Su J.-H., Wu B., Yang X.-J., Chem. Commun. 2015, 51, 1237–1239. [DOI] [PubMed] [Google Scholar]
- 19. Zhao Y., Li Y., Li Q.-S., Su J.-H., Dalton Trans. 2016, 45, 246–252. [DOI] [PubMed] [Google Scholar]
- 20. Scholz J., Dietrich A., Schumann H., Thiele K.-H., Chem. Ber. 1991, 124, 1035–1039. [Google Scholar]
- 21. Mashima K., Matsuo Y., Tani K., Organometallics 1999, 18, 1471–1481. [Google Scholar]
- 22. Amor F., Gomez-Sal P., Royo P., Okuda J., Organometallics 2000, 19, 5168–5173. [Google Scholar]
- 23. Galindo A., Ienco A., Mealli C., New J. Chem. 2000, 24, 73–75. [Google Scholar]
- 24. Matsuo Y., Mashima K., Tani K., Angew. Chem. Int. Ed. 2001, 40, 960–962. [PubMed] [Google Scholar]
- 25. Mashima K., Nakamura A., J. Organomet. Chem. 2001, 621, 224–230. [Google Scholar]
- 26. Matsuo Y., Mashima K., Tani K., Organometallics 2002, 21, 138–148. [Google Scholar]
- 27. Daff P. J., Etienne M., Donnadieu B., Knottenbelt S. Z., McGrady J. E., J. Am. Chem. Soc. 2002, 124, 3818–3819. [DOI] [PubMed] [Google Scholar]
- 28. Tsurugi H., Ohno T., Yamagata T., Mashima K., Organometallics 2006, 25, 3179–3189. [Google Scholar]
- 29. Stanciu C., Jones M. E., Fanwick P. E., Abu-Omar M. M., J. Am. Chem. Soc. 2007, 129, 12400–12401. [DOI] [PubMed] [Google Scholar]
- 30. Kaim W., Chemtracts 2007, 20, 292–296. [Google Scholar]
- 31. Kreisel K. A., Yap G. P. A., Theopold K. H., Inorg. Chem. 2008, 47, 5293–5303. [DOI] [PubMed] [Google Scholar]
- 32. Tsurugi H., Ohno T., Kanayama T., Arteaga-Müller R. A., Mashima K., Organometallics 2009, 28, 1950–1960. [Google Scholar]
- 33. Tsurugi H., Saito T., Tanahashi H., Arnold J., Mashima K., J. Am. Chem. Soc. 2011, 133, 18673–18683. [DOI] [PubMed] [Google Scholar]
- 34. Greene A. F., Chandrasekaran P., Yan Y., Mague J. T., Donahue J. P., Inorg. Chem. 2014, 53, 308–317. [DOI] [PubMed] [Google Scholar]
- 35. Tanahashi H., Ikeda H., Tsurugi H., Mashima K., Inorg. Chem. 2016, 55, 1446–1452. [DOI] [PubMed] [Google Scholar]
- 36. Johnson L. K., Killian C. M., Brookhart M., J. Am. Chem. Soc. 1995, 117, 6414–6415. [Google Scholar]
- 37. Johnson L. K., Mecking S., Brookhart M., J. Am. Chem. Soc. 1996, 118, 267–268. [Google Scholar]
- 38. Rijnberg E., Boersma J., Jastrzebski J. T. B. H., Lakin M. T., Spek A. L., van Koten G., Organometallics 1997, 16, 3158–3164. [Google Scholar]
- 39. Johansson L., Ryan O. B., Tilset M., J. Am. Chem. Soc. 1999, 121, 1974–1975. [Google Scholar]
- 40. Tempel D. J., Johnson L. K., Huff R. L., White P. S., Brookhart M., J. Am. Chem. Soc. 2000, 122, 6686–6700. [Google Scholar]
- 41. Johansson L., Tilset M., Labinger J. A., Bercaw J. E., J. Am. Chem. Soc. 2001, 123, 739–740. [DOI] [PubMed] [Google Scholar]
- 42. Zhong A. H., Labinger J. A., Bercaw J. E., J. Am. Chem. Soc. 2002, 124, 1378–1399. [DOI] [PubMed] [Google Scholar]
- 43. Gomes C. S. B., Gomes P. T., Duarte M. T., J. Organomet. Chem. 2014, 760, 101–107. [Google Scholar]
- 44. Yempally V., Kyran S. J., Raju R. K., Fan W. Y., Brothers E. N., Darensbourg D. J., Bengali A. A., Inorg. Chem. 2014, 53, 4081–4088. [DOI] [PubMed] [Google Scholar]
- 45. Vollmer M. V., Machan C. W., Clark M. L., Antholine W. E., Agarwal J., H. F. Schaefer III , Kubiak C. P., Walensky J. R., Organometallics 2015, 34, 3–12. [DOI] [PMC free article] [PubMed] [Google Scholar]
- 46. Manna B.., Desai A. V., Kumar N., Karmakar A., Ghosh S. K., CrystEngComm 2015, 17, 8796–8800. [Google Scholar]
- 47. Zelenay B., Frutos-Pereno R., Markalain-Barta J., Vega-Isa E., White A. J. P., Diez-Gonzalez S., Eur. J. Inorg. Chem. 2016, 4649–4658. [Google Scholar]
- 48. Recknagel A., Noltemeyer M., Edelmann F. T., J. Organomet. Chem. 1991, 410, 53–61. [Google Scholar]
- 49. Poremba P., Edelmann F. T., J. Organomet. Chem. 1997, 549, 101–104. [Google Scholar]
- 50. Scholz J., Görls H., Schumann H., Weimann H., Organometallics 2001, 20, 4394–4402. [Google Scholar]
- 51. Trifonov A. A., Fedorova E. A., Fukin G. K., Baranov E. V., Druzhkov N. O., Bochkarev M. N., Chem. Eur. J. 2006, 12, 2752–2757. [DOI] [PubMed] [Google Scholar]
- 52. Moore J. A., Cowley A. H., Gordon J. C., Organometallics 2006, 25, 5207–5209. [Google Scholar]
- 53. Trifonov A. A., Borovkov I. A., Fedorova E. A., Fukin G. K., Larionova J., Druzhkov N. O., Cherkasov V. K., Chem. Eur. J. 2007, 13, 4981–4987. [DOI] [PubMed] [Google Scholar]
- 54. Walter M. D., Berg D. J., Andersen R. A., Organometallics 2007, 26, 2296–2307. [Google Scholar]
- 55. Cui P., Chen Y., Wang G., Li G., Xia W., Organometallics 2008, 27, 4013–4016. [Google Scholar]
- 56. Mahrova T. V., Fukin G. K., Cherkasov A. V., Trifonov A. A., Russ. Chem. Bull. 2008, 57, 2285–2290. [Google Scholar]
- 57. Mahrova T. V., Fukin G. K., Cherkasov A. V., Trifonov A. A., Ajellal N., Carpentier J.-F., Inorg. Chem. 2009, 48, 4258. [DOI] [PubMed] [Google Scholar]
- 58. Panda T. K., Kaneko H., Pal K., Tsurugi H., Mashima K., Organometallics 2010, 29, 2610–2615. [Google Scholar]
- 59. Kaneko H., Nagae H., Tsurugi H., Mashima K., J. Am. Chem. Soc. 2011, 133, 19626–19629. [DOI] [PubMed] [Google Scholar]
- 60. Trifonov A. A., Shestakov B. G., Lyssenko K. A., Larionova J., Fukin G. K., Cherkasov A. V., Organometallics 2011, 30, 4882–4889. [Google Scholar]
- 61. Shestakov B. G., Mahrova T. V., Larionova J., Long J., Cherkasov A. V., Fukin G. K., Lyssenko K. A., Scherer W., Hauf C., Magdesieva T. V., Levitskiy O. A., Trifonov A. A., Organometallics 2015, 34, 1177–1185. [Google Scholar]
- 62. Hannant M. D., Schormann M., Bochmann M., J. Chem. Soc. Dalton Trans. 2002, 4071–4073. [Google Scholar]
- 63. Stoffelbach F., Poli R., Richard P., J. Organomet. Chem. 2002, 663, 269–276. [Google Scholar]
- 64. Stoffelbach F., Richard P., Poli R., Jenny T., Savary C., Inorg. Chim. Acta 2006, 359, 4447–4453. [Google Scholar]
- 65. Roukoss C., Fiddy S., de Mallmann A., Rendon N., Basset J.-M., Kuntz E., Coperet C., Dalton Trans. 2007, 5546–5548. [DOI] [PubMed] [Google Scholar]
- 66. Anga S., Naktode K., Adimulam H., Panda T. K., Dalton Trans. 2014, 43, 14876–14888. [DOI] [PubMed] [Google Scholar]
- 67. Liu Y., Yang L., Chin. J. Chem. 2015, 33, 473–478. [Google Scholar]
- 68. Liao H., Zhong L., Xiao Z., Zheng T., Gao H., Wu Q., Chem. Eur. J. 2016, 22, 14048–14055. [DOI] [PubMed] [Google Scholar]
- 69. Nishiyama H., Ikeda H., Saito T., Kriegel B., Tsurugi H., Arnold J., Mashima K., J. Am. Chem. Soc. 2017, 139, 6494–6505. [DOI] [PubMed] [Google Scholar]
- 70. Liu J., Chen W., Li J., Cui C., ACS Catal. 2018, 8, 2230–2235. [Google Scholar]
- 71. Knisley T. J., Saly M. J., Heeg M. J., Roberts J. L., Winter C. H., Organometallics 2011, 30, 5010–5017. [Google Scholar]
- 72. Pugh T., Cosham S. D., Hamilton J. A., Kingsley A. J., Johnson A. L., Inorg. Chem. 2013, 52, 13719–13729. [DOI] [PubMed] [Google Scholar]
- 73. Long J., Shestakov B. G., Liu D., Chibotaru L. F., Guari Y., Cherkasov A. V., Fukin G. K., Trifonov A. A., Larionova J., Chem. Commun. 2017, 53, 4706–4709. [DOI] [PubMed] [Google Scholar]
- 74. Richter B., Scholz J., Neumüller B., Weimann R., Schumann H., Z. Anorg. Allg. Chem. 1995, 621, 365–372. [Google Scholar]
- 75. Baker R. J., Farley R. D., Jones C., Kloth M., Murphy D. M., J. Chem. Soc. Dalton Trans. 2002, 3844–3850. [Google Scholar]
- 76. Power P. P., Chem. Rev. 2003, 103, 1789–1809. [DOI] [PubMed] [Google Scholar]
- 77. Baker R. J., Farley R. D., Jones C., Mills D. P., Kloth M., Murphy D. M., Chem. Eur. J. 2005, 11, 2972–2982. [DOI] [PubMed] [Google Scholar]
- 78. Corn I. R., Astudillo-Sanchez P. D., Zdilla M. J., Fanwick P. E., Shaw M. J., Miller J. T., Evans D. H., Abu-Omar M. M., Inorg. Chem. 2013, 52, 5457–5463. [DOI] [PubMed] [Google Scholar]
- 79. Patra S. C., Roy A. S., Mannivannan V., Weyhermüller T., Ghosh P., Dalton Trans. 2014, 43, 13731–13741. [DOI] [PubMed] [Google Scholar]
- 80. Walther D., Z. Chem. 1974, 14, 285–286. [Google Scholar]
- 81. Robinson S., Davis E. S., Lewis W., Blake A. J., Liddle S. T., Dalton Trans. 2014, 43, 4351–4360. [DOI] [PubMed] [Google Scholar]
- 82. Allen C. J., Cooper B. F. T., Cowley H. J., Rawson J. M., Macdonald C. L. B., Chem. Eur. J. 2013, 19, 14470–14483. [DOI] [PubMed] [Google Scholar]
- 83. Bhadbhade M., Klentsmith G. K. B., Field L. D., Organometallics 2011, 29, 6509–6517. [Google Scholar]
- 84. Maly T., MacMillan F., Zwicker K., Kashani-Poor N., Brandt U., Prisner T. F., Biochemistry 2004, 43, 3969–3978. [DOI] [PubMed] [Google Scholar]
- 85. Harmer J., Finazzo C., Piskorski R., Ebner S., Duin E. C., Goenrich M., Thauer R. K., Reiher M., Schweiger A., Hinderberger D., Jaun B., J. Am. Chem. Soc. 2008, 130, 10907–10920. [DOI] [PubMed] [Google Scholar]
- 86. Prisner T. F., Adv. Magn. Opt. Reson. 1997, 20, 245–299. [Google Scholar]
- 87. Stoll S., Jeschke G., Willer M., Schweiger A., J. Magn. Reson. 1998, 130, 86–96. [DOI] [PubMed] [Google Scholar]
- 88. Eichel R.-A., Schweiger A., J. Magn. Reson. 2001, 152, 276–287. [Google Scholar]
- 89. Hoffmann E., Schweiger A., Appl. Magn. Reson. 1995, 9, 1–22. [Google Scholar]
- 90. Yoshida H., Ichikawa T., Adv. Polym. Sci. 1993, 105, 3–36. [Google Scholar]
- 91. Lawrence C. C., Benatti M., Obias H. V., Bar G., Griffin R. G., Proc. Natl. Acad. Sci. USA 1999, 96, 8679–8984. [DOI] [PMC free article] [PubMed] [Google Scholar]
- 92. Levitt M. H., eMagRes 2010, 10.1002/9780470034590.emrstm1036. [DOI] [Google Scholar]
- 93. Cope-Eatough E. K., Mair F. S., Pritchard R. G., Warren J. E., Woods R. J., Polyhedron 2003, 22, 1447–1454. [Google Scholar]
- 94. Pasimeni L., Corvaja C., J. Chem. Soc. Faraday Trans. 2 1978, 74, 380–387. [Google Scholar]
- 95. Ondar M. A., Grinberg O. Y., Dubinskii A. A., Lebedev Y. S., Sov. J. Chem. Phys. 1985, 3, 781–792. [Google Scholar]
- 96. Snipes W., Cupp J., Cohn G., Keith A., Biophys. J. 1974, 14, 20–32. [DOI] [PMC free article] [PubMed] [Google Scholar]
- 97. Kawamura T., Matsunami S., Yonezawa T., Bull. Chem. Soc. Jpn. 1967, 40, 1111–1115. [Google Scholar]
- 98. Janes T., Rawson J. M., Song D., Dalton Trans. 2013, 42,10640–10648. [DOI] [PubMed] [Google Scholar]
- 99. Stoll S., Schweiger A., J. Magn. Reson. 2006, 178, 42–45. [DOI] [PubMed] [Google Scholar]
- 100. Neese F., Comput. Mol. Sci. 2012, 2, 73–78. [Google Scholar]
- 101. Becke A. D., J. Chem. Phys. 1993, 98, 5648–5652. [Google Scholar]
- 102. Yang L. W., Parr R. G., Phys. Rev. B 1998, 37, 785–789. [DOI] [PubMed] [Google Scholar]
- 103. Hariharan P. C., Pople J. A., Theor. Chim. Acta 1973, 28, 213–222. [Google Scholar]
- 104. Schäfer A., Huber C., Ahlrichs R., J. Chem. Phys. 1994, 100, 5829–5835. [Google Scholar]
- 105. Adamo C., Barone V., J. Chem. Phys. 1999, 110, 6158–6170. [Google Scholar]
- 106. https://www.ccdc.cam.ac.uk/services/structures?id=doi:10.1002/open.201800114 1838549 [Li(Me2DADDipp)(dme)] contains the supplementary crystallographic data for this paper. These data can be obtained free of charge from http://www.ccdc.cam.ac.uk/.
- 107. Altomare A., Burla M. C., Camalli M., Cascarano G., Giacovazzo C., Guagliardi A., Moliterni A. G. G., Polidori G., Spagna R., J. Appl. Crystallogr. 1999, 32, 115–119. [Google Scholar]
- 108. Sheldrick G. M., Acta Crystallogr. 2015, C71, 3–8. [Google Scholar]
Associated Data
This section collects any data citations, data availability statements, or supplementary materials included in this article.
Supplementary Materials
As a service to our authors and readers, this journal provides supporting information supplied by the authors. Such materials are peer reviewed and may be re‐organized for online delivery, but are not copy‐edited or typeset. Technical support issues arising from supporting information (other than missing files) should be addressed to the authors.
Supplementary