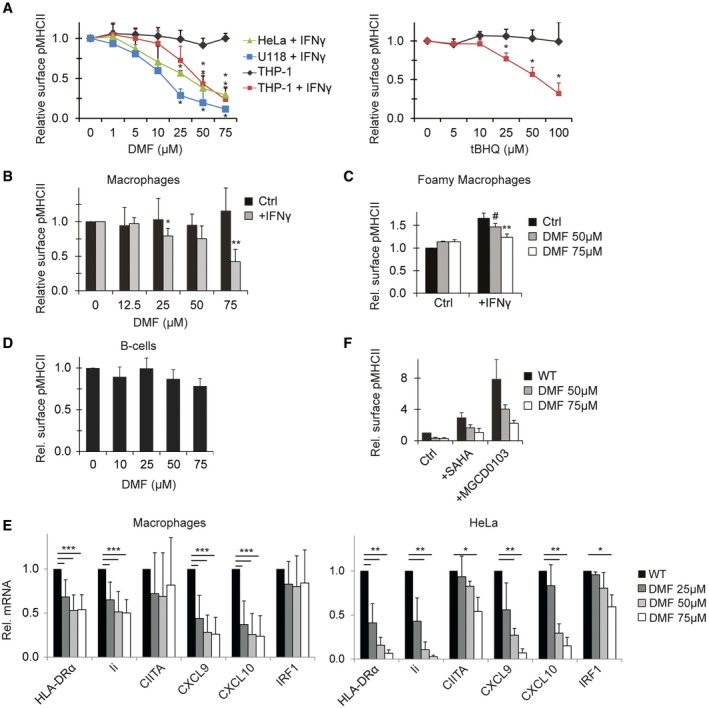
THP‐1, HeLa and U118 cells either or not exposed to IFNγ for 48 h were cultured in the presence of DMF (left) or tBHQ (right) at indicated concentrations before analyses of MHCII expression by flow cytometry. Since THP1 express constitutive MHCII, MHCII expression is normalized by subtracting MFI of non‐IFNγ exposed THP1. Data normalized to MFI measured in the absence of drugs. Shown is mean + SD, n = 3.
Monocyte‐derived macrophages were treated with the indicated concentration of DMF and either or not stimulated with IFNγ for 48 h. MHCII expression was determined by flow cytometry. Shown is mean + SD of four independent experiments. For IFNγ‐treated samples, MFI of control unstimulated macrophages was subtracted.
Foamy macrophages were treated with the indicated concentrations of DMF and either or not activated with IFNγ for 24 h when indicated before MHCII expression was determined by flow cytometry. Shown is mean + SD, n = 3.
Primary human B cells were cultured for 24 h in different concentrations of DMF as indicated, and surface MHCII expression was analysed by flow cytometry. Shown is mean + SD, n = 4.
Macrophages (left) or HeLa cells (right) were cultured for 24 h in the presence of IFNγ and DMF when indicated before mRNA expression analysis of the indicated proteins using qRT–PCR. Shown is mean + SD of experiments repeated eightfold (macrophages) or threefold (HeLa).
HeLa cells were cultured for 48 h with IFNγ in the presence or absence of the indicated inhibitors, and expression of MHCII was determined by flow cytometry. Concentrations: SAHA (5 μM), MGCD0103 (1 μM). Shown is mean MHCII expression + SD of triplicate experiments.
Data information: Statistical significance was calculated compared to control cells using a Student's
< 0.001).

