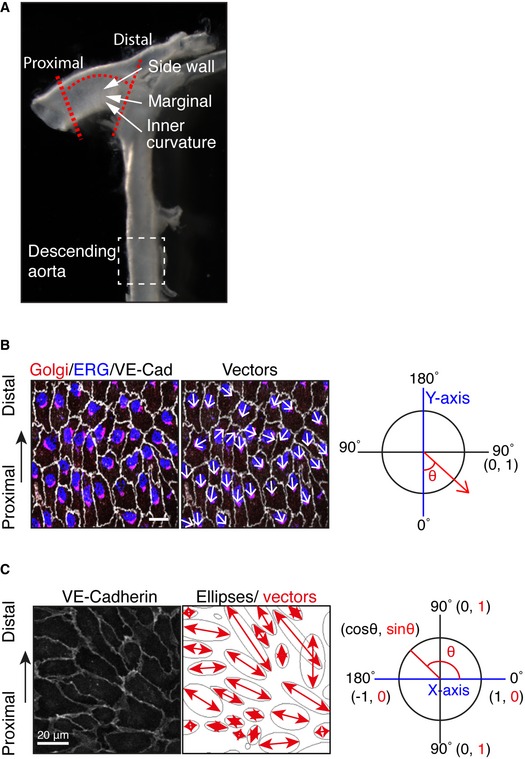
Figure EV2. Analysis of ECs in the aorta.

- To examine the effect of loss of PAR‐3, the highlighted region of the aorta within the red dotted lines was dissected and analyzed.
- To quantify endothelial Golgi orientation toward flow, the angle between the axial polarity vector and the proximal–distal vector (−1 to 1) was analyzed. White arrows indicate the axial polarity vectors from each EC.
- Left panel shows the VE‐cadherin signal of aorta ECs. Right panel shows the ellipse fitted to each of the EC, generated by ImageJ software. Red arrows indicate the vectors of the major axis of each ellipse. Distribution of the sin(θ) of the angle between the axial polarity vector and the proximal–distal vector was analyzed (0 to 1).
