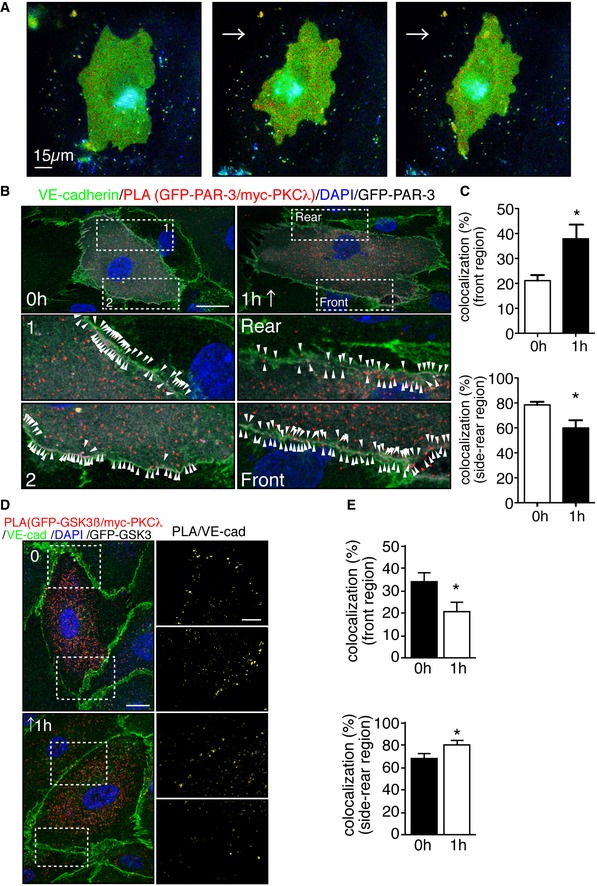
Representative time‐lapse images of ECs transfected with RhoA biosensor. FRET/CFP ratio is represented in IMD mode. Cells were subjected to laminar flow of 12 dyn/cm2 flow for 2 h. Scale bar, 15 μm.
PLA in ECs expressing GFP‐PAR‐3 and myc‐PKCλ in static and under 18 dyn/cm2 flow for 1 h. Arrowheads indicate PAR‐3/aPKCλ PLA signal colocalized with EC junction. Scale bar, 20 μm.
Quantification of the images shown in (B).
Representative images of PLA in ECs expressing GFP‐GSK3β and myc‐PKCλ in static (0 h) and after 1 h subjected to 18 dyn/cm2 flow. EC junction (VE‐cadherin) is green, nuclear stain (DAPI) is blue, and GFP‐GSK3β is gray. Right panels show higher magnification images of the indicated areas. Yellow signals indicate PLA signal colocalized with EC junction. Scale bars, 10 μm (left panel) and 20 μm (right panel).
Quantification of percentile of the PLA signals in the front and rear region of the ECs under static and 1‐h treatment with flow.
Data information: Direction of the flow is indicated in the pictures with arrows. In (C and E), data are means ± SEM (
n = 3 experiments,
n = 30 cells from each experiment); statistical significance (*
P < 0.05) was analyzed with Student's
t‐test (C, E).

