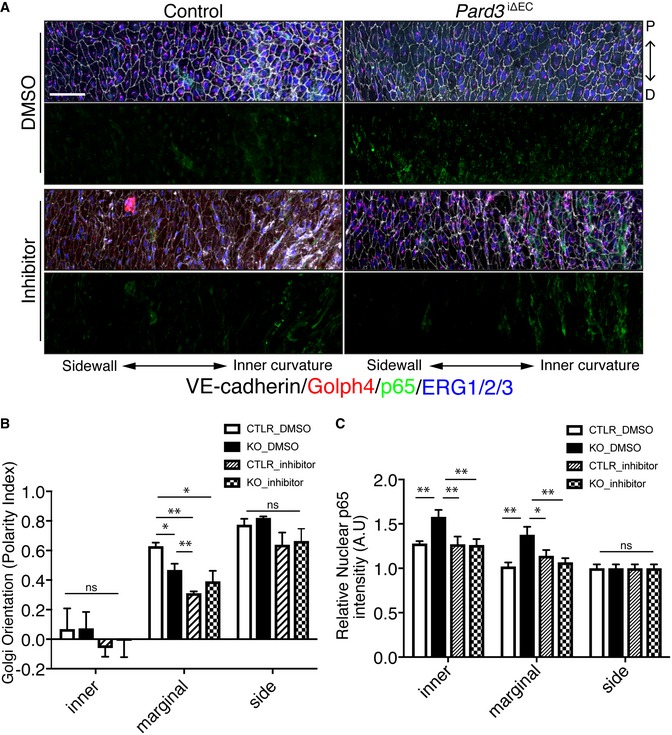
Figure 6. GSK3β indirectly controls EC polarity toward the flow axis and anti‐inflammatory effects in vivo .

-
AEn face confocal microscopy of the aortic arch from the inner curvature to sidewall of control and mutant mice treated with GSK3β inhibitor. Scale bar: 50 μm.
-
B, CRegional quantification of Golgi orientation (Polarity Index, B) and nuclear p65 intensity (C) of ECs. Data are presented as mean ± SEM (n = 5 mice, n = 50 cells from each region). Differences: *P < 0.05, **P < 0.01, analyzed with two‐way ANOVA with Tukey's multiple comparison post hoc analysis.
