-
A
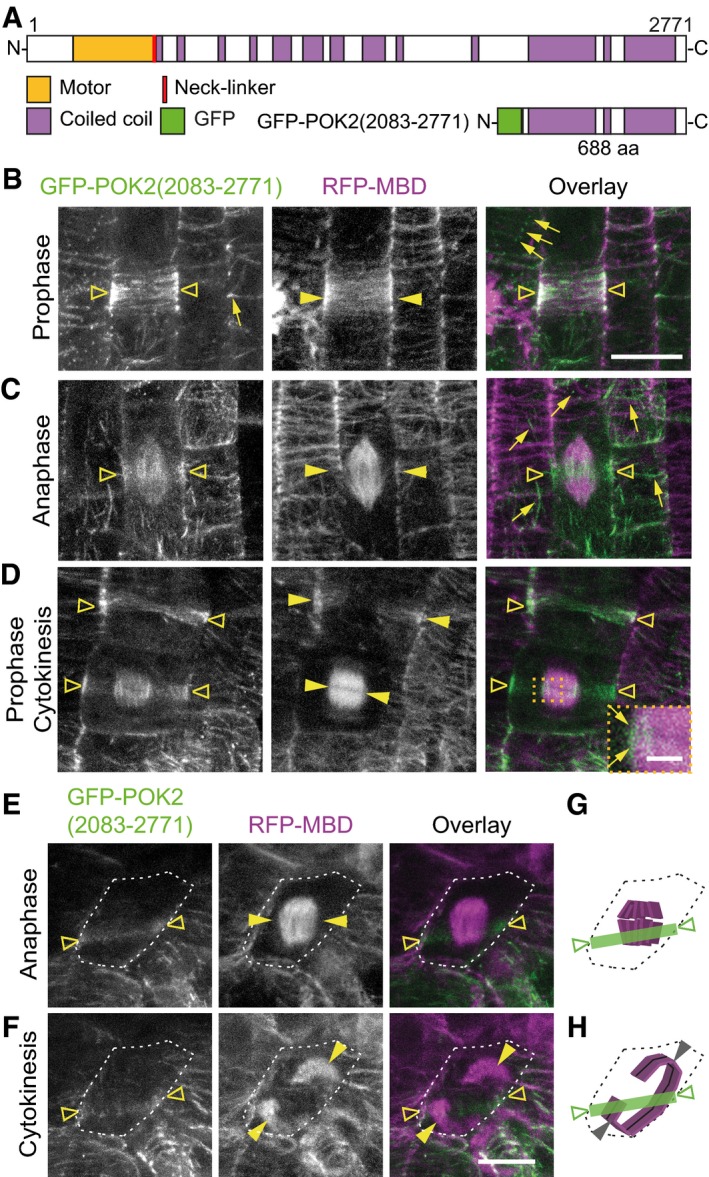
Protein domain organization of POK2 and GFP‐POK2 (2,083–2,771).
-
B–D
POK2 (2,083–2,771) localizes to the cortical division zone (triangles) throughout mitosis. (B) POK2 (2,083–2,771) (triangles) co‐localizes with preprophase band (arrow heads). (C) Anaphase cell exhibiting GFP‐POK2 signal (triangles) at the cortical division zone and the spindle and (D) prophase and cytokinetic cell displaying preprophase band and phragmoplast (arrow heads) and GFP‐POK2 (2,083–2,771) (triangles) at the preprophase band, phragmoplast and cortical division zone. Inset shows magnification of boxed area; arrows point to GFP‐POK2 (2,083–2,771) at the phragmoplast leading zone. Examples of GFP‐POK2 (2,083–2,771) labeled interphase microtubules are indicated by arrows in (B) and (C).
-
E, F
Cell of pok1 pok2 double mutant with intact GFP‐POK2 (2,083–2,771) cortical division zone localization (triangle). (E) Upper and (F) lower panels show the same cell (cell shape is indicated by dashed line in ana‐ and telophase). Note the mismatch between the GFP‐POK2 (2,083–2,771) cortical division zone signal at the plasma membrane (triangles) and direction of the phragmoplast expansion (arrow heads). Microtubules are visualized by RFP‐MBD (magenta).
-
G, H
Illustration of cell outlines (dashed line), microtubules (magenta), and GFP‐POK2 (2,083–2,771) signal distribution (green) of cell depicted in (E and F).
Data information: Scale bars indicate 10 μm, except for (D) indicating 2.5 μm. Relates to Fig
.

