-
A
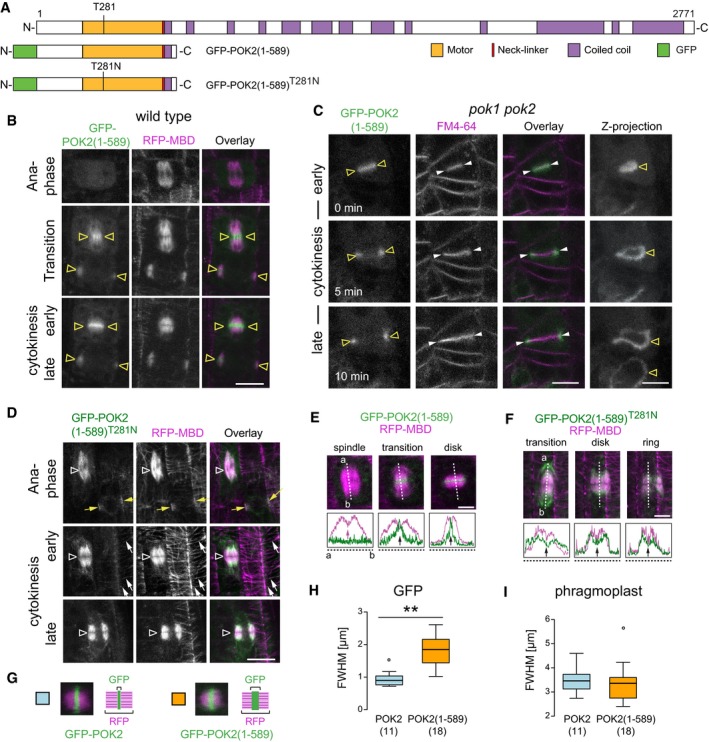
Domain organization and overview of fusion proteins. N‐terminal domain POK2 (1–589) including predicted disordered regions (white), motor domain (yellow), neck‐linker (red), and coiled coil. The position of conserved threonine (T) 281 in the ATP‐binding site and mutation of T281 to asparagine (N) in GFP‐POK2 (1–589)T281N rigor mutant is indicated.
-
B
GFP‐POK2 (1–589) accumulates at the phragmoplast midzone (triangles) during the transition from ana‐ to telophase and remains restricted to the midzone.
-
C
Single plane images of a time series during cytokinesis in the pok1 pok2 double mutant. GFP‐POK2 (1–589) co‐localizes with the early cell plate (triangles), stained with FM4‐64 (arrow heads), and associates with the cell plate margins throughout cytokinesis. Z‐projections illustrate the ring‐shaped localization of GFP‐POK2 (1–589). Note that the POK2 motor domain does not localize to the division site and does not rescue the pok1 pok2 mutant phenotype.
-
D
The rigor mutant GFP‐POK2 (1–589)T281N localizes to mitotic and cortical microtubules (white arrows). Yellow arrows indicate a preprophase band in the upper panel; triangles indicate the phragmoplast midzone region.
-
E, F
Individual images of a time series, showing (E) GFP‐POK2 (1–589) and (GFP‐POK2 (1–589)T281N signal in cytokinesis. Plot profiles illustrate GFP (green) and RFP (magenta) signal distribution along the dashed lines in the respective figure panels above. Arrows in plot profiles point to intensity maxima (peaks) or local minima (valleys).
-
G–I
Comparison between signal width of GFP‐POK2 and GFP‐POK2 (1–589) in cytokinesis. (H and I) Full width at half maximum (FWHM) of (H) GFP‐POK2 (blue, 0.94 ± 0.25 μm, mean ± SD, n = 11) and GFP‐POK2 (1–589) (yellow, 1.81 ± 0.47 μm, mean ± SD, n = 18) differs significantly (**P = 0.001, one‐way ANOVA and Tukey HSD) while FWHMs of (I) phragmoplast are comparable (3.45 ± 0.52 μm, mean ± SD, n = 11 and 3.37 ± 0.80 μm, mean ± SD, n = 18, respectively). Box ranges represent median and 25th and 75th percentiles, respectively. Tukey–whiskers extend to data points that are < 1.5 × IQR away from 25th/75th quartile, outlier is indicated by circles.
Data information: Scale bars indicate 10 μm (B–D) and 5 μm (E, F). Relates to Fig
.

