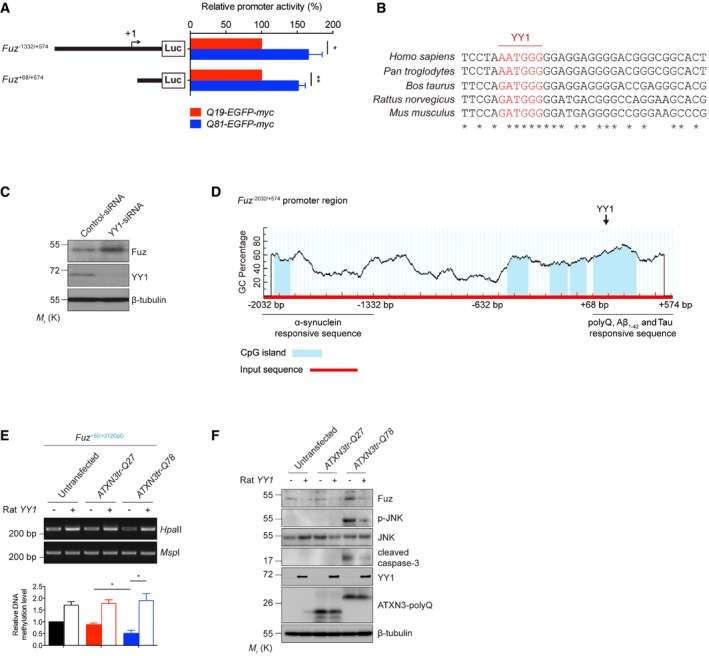
Luciferase assay was performed to examine human Fuz promoter activity in Q19‐EGFP‐myc or Q81‐EGFP‐myc‐expressing HEK293 cells. Two expanded polyQ‐responsive regions, Fuz
−1332/+574 and Fuz
+68/+574, were identified. Error bars represent s.e.m., n = 5. Statistical analysis was performed using two‐tailed unpaired Student's t‐test. *P < 0.05, **P < 0.01.
Inter‐species sequence comparison of the human (Homo sapiens), chimpanzee (Pan troglodytes), cow (Bos taurus), rat (Rattus norvegicus) and mouse (Mus musculus) Fuz promoter regions. Nucleotides highlighted in red indicate putative YY1 binding sites. “*” indicates the identical nucleotides among the different species.
Knockdown of YY1 expression increased the protein expression of Fuz in HEK293 cells. n = 3.
A diagram illustrates the location of five putative CpG islands (blue) within the human Fuz
−2032/+574 promoter region. A putative YY1 binding site was uncovered within Fuz
+117/+347CpG. This diagram also summarizes the Fuz promoter sequences that are responsive to the different disease proteins and peptide. Fuz
−2032/−1332 responds to α‐synuclein overexpression. Fuz
+68/+574 responds to expanded polyQ overexpression, Aβ1–42 peptide treatment and Tau overexpression.
HpaII DNA methylation assay was performed to determine the methylation status of Fuz
+50/+312CpG in rat primary cortical neurons. The ATXN3tr‐Q78‐induced hypomethylation in Fuz promoter was rescued by rat YY1 overexpression. Lower panel shows the quantification of DNA methylation level of Fuz
+50/+312CpG relative to controls. Error bars represent s.e.m., n = 3. Statistical analysis was performed using one‐way ANOVA followed by post hoc Tukey's test. *P < 0.05.
Overexpression of rat YY1 suppressed the ATXN3tr‐Q78‐mediated Fuz induction, JNK phosphorylation and caspase‐3 cleavage in rat primary cortical neurons. n = 3.
Data information: Beta‐tubulin was used as loading control.
represents the number of biological replicates. Only representative gels and blots are shown.

