-
A
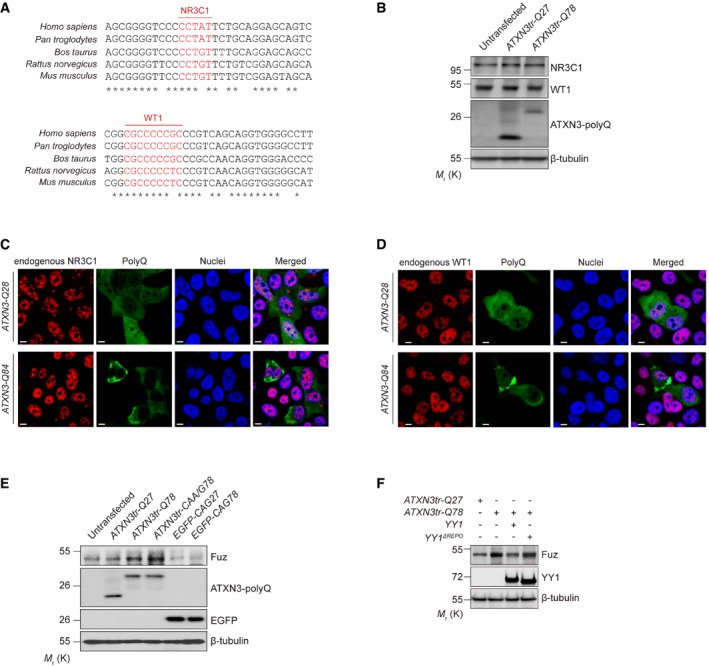
Inter‐species sequence comparison of the human (Homo sapiens), chimpanzee (Pan troglodytes), cow (Bos taurus), rat (Rattus norvegicus) and mouse (Mus musculus) Fuz promoter regions. Nucleotides highlighted in red indicate putative NR3C1 and WT1 binding sites. “*” indicates the identical nucleotides among the different species.
-
B
Endogenous soluble NR3C1 and WT1 protein levels were not altered in ATXN3tr‐Q78‐expressing HEK293 cells. n = 3.
-
C, D
Both the NR3C1 (C) and WT1 (D) proteins showed nuclear localization in both ATXN3‐Q28‐and ATXN3‐Q84‐expressing cells. NR3C1 (C) and WT1 (D) were not detected in protein aggregate in ATXN3‐Q84‐expressing cells. Cell nuclei (blue) were stained with Hoechst 33342. Scale bars: 5 μm. n = 3.
-
E
Overexpression of either ATXN3tr‐Q78 or ATXN3tr‐CAA/G78 induced the expression of Fuz protein in HEK293 cells. Such induction was not observed in cells transfected with EGFP‐CAG78 expresses only the expanded CAG transcript but not polyQ protein. n = 3.
-
F
YY1ΔREPO was less effective than full‐length YY1 in suppressing Fuz induction in ATXN3tr‐Q78‐expressing cells. n = 3.
Data information: Beta‐tubulin was used as loading control.
n represents the number of biological replicates. Only representative images and blots are shown.
Source data are available online for this figure.

